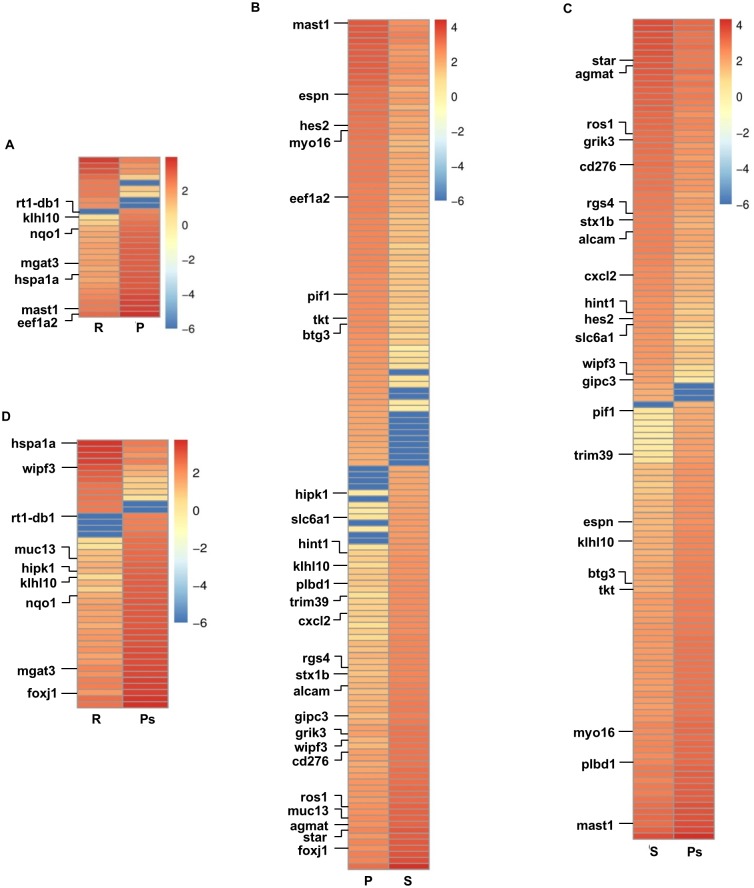
Fig 5. Heat map representation of significantly differentially expressed testicular transcripts.
Shows testicular transcripts showing significant (corrected P value < 0.05) differential expression based on comparison between different reproductive phases (resting: R, preparatory: P, spawning: S and postspawning: Ps): (A) R and P, (B) P and S, (C) S and Ps and (D) R and Ps. Transcripts differentially expressed in more than two reproductive phases are labelled.

