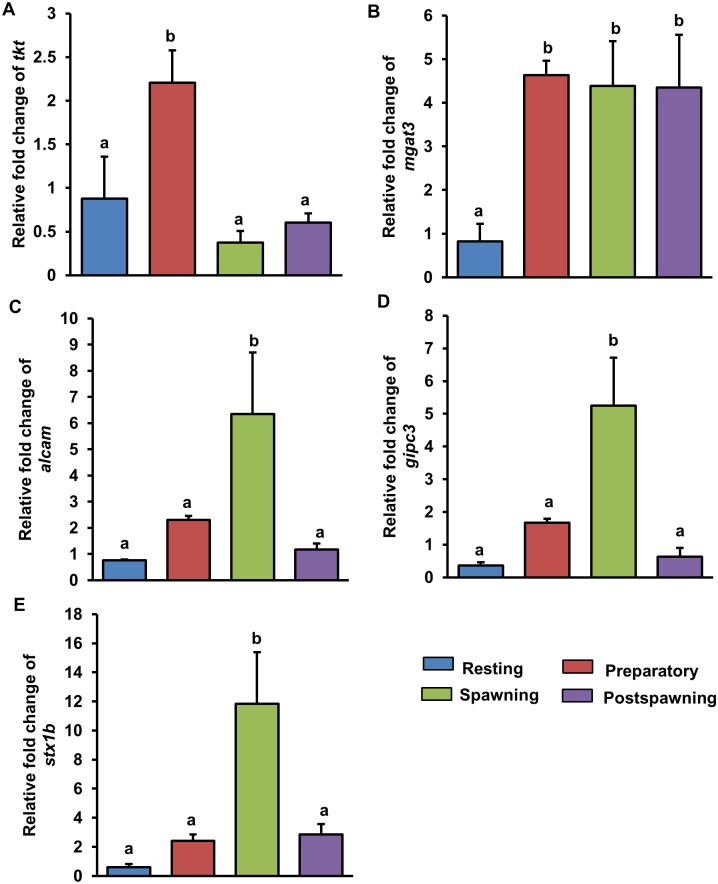
Fig 6. Showing expression fold change of some differentially expressed testicular genes tkt (A), mgat3 (B), alcam (C), gipc3 (D) and stx1b (E) along the reproductive cycle.
The expression fold change of genes during preparatory, spawning and postspawning phases were calculated using expression values obtained during resting phase as reference. Ribosomal 18s RNA was used as the house-keeping gene for normalization of expression values. Three testicular samples were used for each reproductive phase (N = 3). Data represented as mean ± SEM were analyzed by one way analysis of variance (ANOVA) and compared by Newman-Keuls multiple range test. Groups with different alphabets (a-b) as superscripts show significant difference (P < 0.05).

