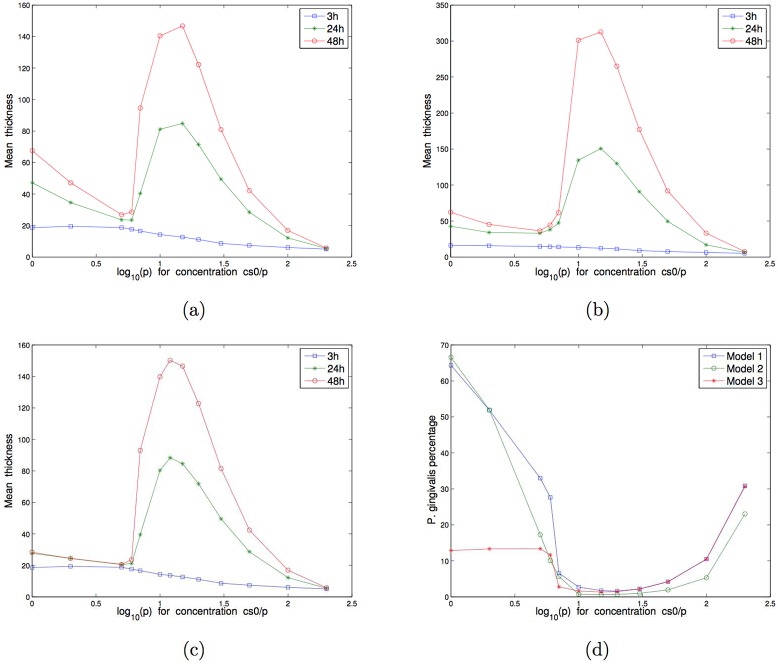
Fig 9. Two-species biofilm growth simulations with and .
Mean of 50 simulations of the mean thickness at 3h, 24h and 48h with respect to the concentration of nutrients for different values of p: (a) Model 1 for P. gingivalis and S. gordonii independent, (b) Model 2 for P. gingivalis and S. gordonii in competition for proteins, (c) Model 3 for P. gingivalis and S. gordonii with production of toxic substance. (d) P. gingivalis percentage in biofilms for the 3 models.

