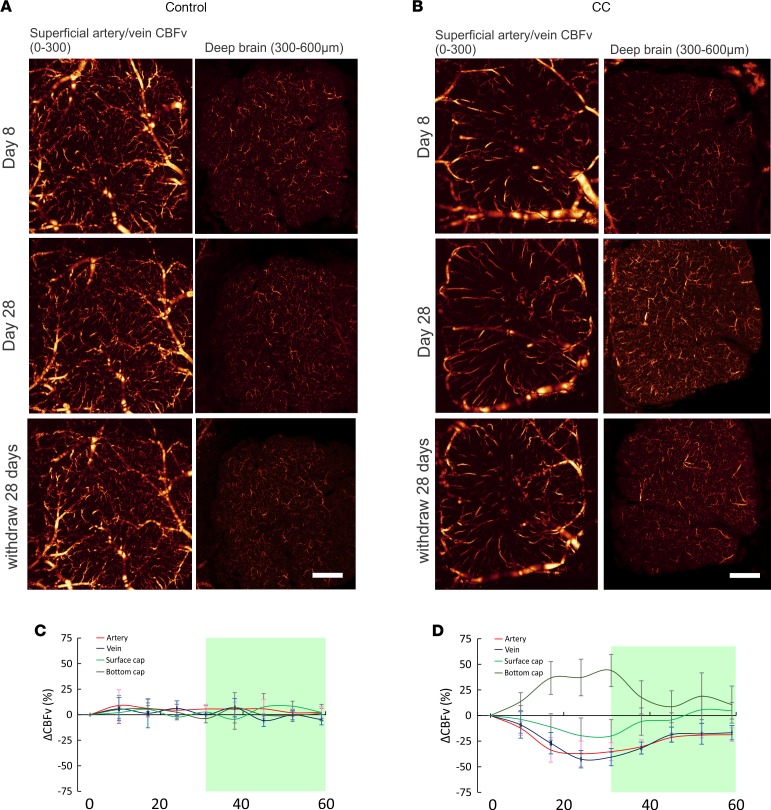
Figure 6. Chronic cocaine elicited CBFv reorganization in the sensorimotor cortex.
(A) μODT images of superficial (A, C: L1, L2/3, 0–300 μm) layers and deep cortical (B, D: L4, 300–600 μm) layers of a control mouse acquired day 8 and day 28 through a chronic cranial window. (B) Mouse undergoing chronic cocaine exposures (35 mg/kg/day, i.p.). (C and D) Time courses of CBFv (%) in arteries (red), veins (blue), superficial (light green), and deep (dark green) capillaries in control (n = 5) and chronic cocaine (n = 5) mice, respectively. CBFv change (C and D) were tested for significant difference using one-way repeated measures ANOVA followed by a post-hoc test (Holm-Sidak method). Scale bar: 500 μm.

