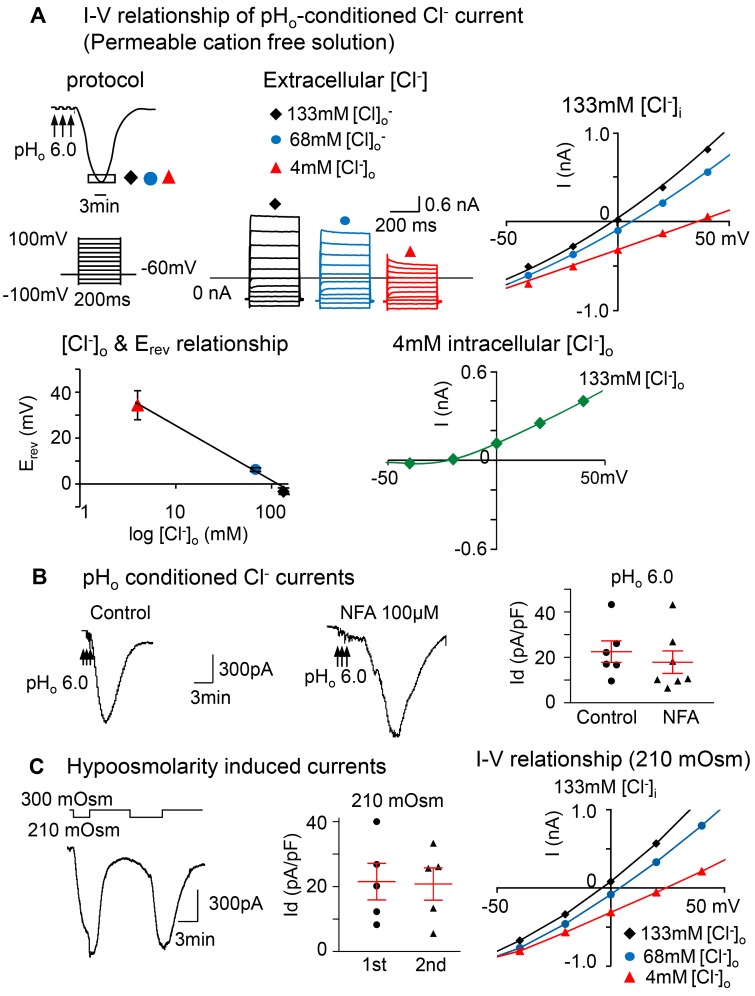
Figure 2. The prolonged pHo-conditioned current is Cl– selective and similar to the hypoosmolarity-induced current.
(A) The current-voltage (I-V) relationship was obtained during the peak activation of the pHo-conditioned current (boxed area at the nadir of the curve). The voltage was changed from –100 mV to +100 mV with 20 mV increments, each lasting 200 ms with an interval of 1 second. The holding potential was –60 mV. Overlay of currents recorded during the I-V protocol described above were obtained in solutions free of intra- and extracellular cations under 3 different conditions: one with equivalent intra- and extracellular [Cl–] of 133 mM and the other 2 with intracellular [Cl–]i of 133 mM and extracellular [Cl–]o of 68 and 4 mM. The I-V curve obtained with equivalent concentrations of [Cl–] (black) has a reversal potential of –3.32 ± 0.63 mV; the reversal potential for 68 (blue) and 4 mM of [Cl–]o (red) are 6.34 ± 0.55 mV and 34.33 ± 2.57 mV. The curve relating the reversal potential to the log of [Cl–]o concentration displays a linear relationship (n = 5 neurons from 3 mice). The I-V curve recorded at 4 mM intracellular [Cl–]i and normal 133 mM extracellular [Cl–]o (green) shows a shift in the reversal potential to a negative voltage (–26.4 ± 3.8 mV, n = 3 neurons from1 mouse). Notice that the inward current is nearly eliminated. (B) The tracings show pHo-conditioned currents unaltered in the presence of 100 μM niflumic acid (NFA), the Ca2+-activated Cl– channel blocker. The panel shows mean pHo 6.0 conditioned current densities in control neurons (22.5 ± 4.7 pA/pF; n = 3 mice) vs. NFA-treated neurons (17.9 ± 5.0 pA/pF; n = 3 mice; P > 0.05; unpaired 2-tailed student’s t test). (C) Tracings show that typical large inward currents evoked in nodose neurons by 2 consecutive exposures to hypoosmolarity (210 mOsm) are reproducible, and the kinetics resemble the low pHo conditioned current. The panel shows that the mean current densities ± SE are 21.5 ± 5.6 for the first and 20.8 ± 5.0 pA/pF for the second exposure (n = 4 mice, P > 0.05; paired 2-tailed Student’s t test). They are also similar to the pHo-conditioned currents shown above in B. The I-V relationship obtained near the nadir of the current induced by 210 mOsm is also similar to that induced by low pHo and shows a reversal potential near 0 at equimolar [Cl–]i (–4.2 mV) with [Cl–]o of 133 mM (black) and a progressive shift to more positive potentials with reduced [Cl–]o to 68 (3.6 mV) and 4 mM (24.5 mV) (blue and red, respectively).

