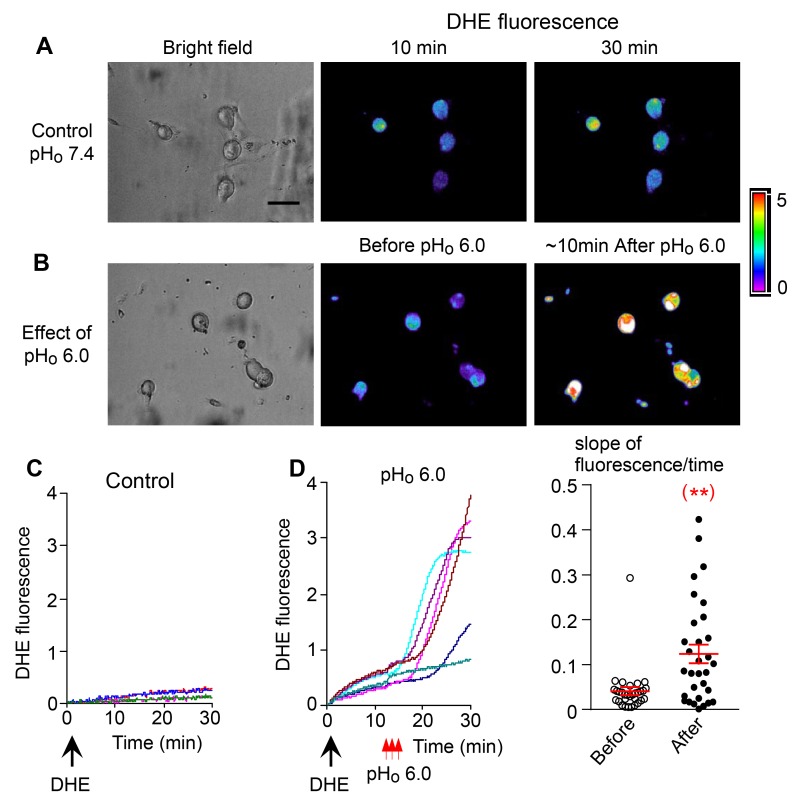
Figure 5. ROS generation during the pHo-conditioned current.
The images in A and B represent the bright fields and dihydroethidium (DHE) fluorescence images of 2 different cultures of nodose neurons. (A) The cells were observed for up to 30 minutes after DHE loading in a bath solution at pHo 7.4, without exposing them to low pHo 6.0 (control). (B) The cells were loaded with DHE and then exposed transiently to pHo 6.0. The middle image shows minimal fluorescence before exposure to pHo 6.0, and the right image shows pronounced fluorescence approximately 10 minutes after exposure to pHo 6.0. The corresponding graphs (C and D) show that after loading with DHE (large black arrows); the slope of spontaneous fluorescence seen over 30 minutes without exposure to low pHo is minimal in C (control cells) as reflected in the third fluorescence image in A. (D) The slope is dramatically increased following the 3 transient exposures to pHo 6.0 (small red arrows) as reflected in fluorescence image in B. The dot plot shows the slopes of fluorescence of individual neurons averaging 0.04 ± 0.01 units/min before and 0.12 ± 0.02 units/min after exposure to low pHo (n = 31 neurons from 2 mice, **P < 0.01 compared with before exposure). Statistical comparison is a paired 2-tailed Student’s t test.

