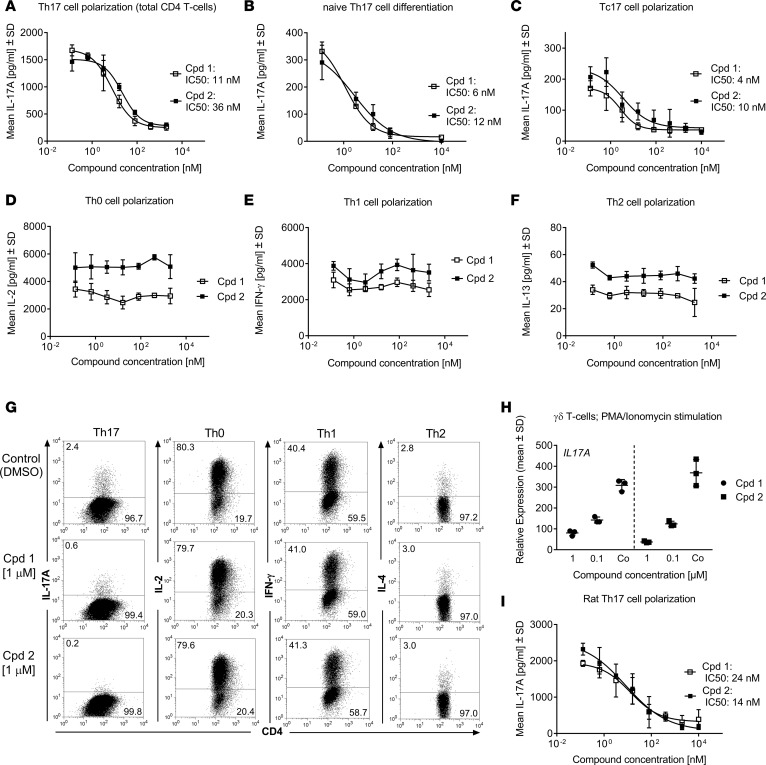
Figure 2. Effects of retinoic-acid-orphan-receptor-C (RORC) inhibitors (cpd 1 and cpd 2) on T cells in vitro.
RORC inhibitors (cpd 1 and cpd 2) specifically suppress human Th17 (A–B) or Tc17 cell polarization (C), while leaving Th0 (D), Th1 (E), or Th2 (F) signature cytokine production intact. Representative examples of concentration-response curves from 3 experiments with triplicate readings are shown. Total (A) or naive CD4+ (B) or CD8+ (C) T cells derived from blood of human healthy donors were stimulated with anti-CD3 and anti-CD28 antibodies in the presence of Th17-polarizing cytokines for 72 or 96 hours, and IL-17A production was quantified. Alternatively, CD4+ T cells were stimulated with anti-CD3/CD28 only (Th0) (D) and incubated with IL-12 and anti–IL-4 antibody (Th1) (E), or with IL-4 and anti–IFN-γ antibody (Th2) (F). IL-2, IFN-γ, and IL-13 cytokine production by the respective Th subsets was analyzed by ELISA after 48 hours. (G) Human CD4+ T cells were activated under Th17-, Th0-, Th1-, or Th2-polarizing conditions in the presence of RORC inhibitors or DMSO. Production of IL-17A, IL-2, IFN-γ, or IL-4 was analyzed by intracellular staining and flow cytometry. Intracellular cytokines within CD4+ T cell blasts are shown. Data are representative of 2 independent experiments. (H) Human γδ T cells were incubated with RORC inhibitors or DMSO only (Co) and stimulated with PMA/ionomycin for 24 hours. IL17A transcript levels were quantified by RT-PCR. Gene expression was normalized to β-glucuronidase levels and is expressed as arbitrary units. Results are representative of 2 independent experiments. Individual data and mean ± SD from triplicate readings are depicted. (I) CD4+ T cells isolated from splenocytes from male Lewis rats were stimulated with anti-CD3 and anti-CD28 antibodies in the presence of Th17-polarizing cytokines. IL-17A concentrations in supernatants were determined by ELISA. Representative examples of concentration-response curves from 3 experiments with triplicate readings are shown.

