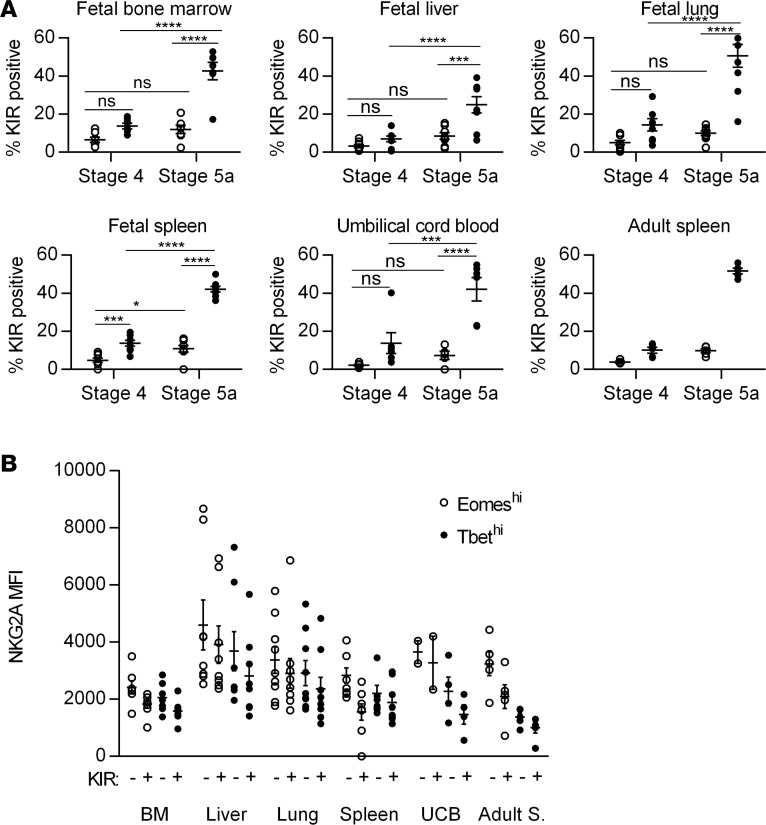
Figure 4. Eomeshi cells are less mature than T-bethi cells based on killer immunoglobulin receptor (KIR) and NKG2A expression.
(A) Mean frequencies ± SEM of KIR expression (based on pan-KIR staining for KIR2DL1, KIR2DS1, KIR2DL2, KIR2DS2, KIR2DL3, KIR2DS3, KIR2DS4, and KIR2DS5) on lineage-negative (Linneg: depleted of T cells, B cells, DCs, monocytes, granulocytes, erythroid cells, and CD34+ precursor cells) CD161+ stage 4 and 5 Eomeshi (open circles) and T-bethi (closed circles) cells from indicated tissues. Fetal bone marrow (BM), n = 7; fetal liver, n = 8; fetal lung, n = 9; fetal spleen, n = 8; umbilical cord blood (UCB), n = 6; adult spleen, 5 independent measurements made on n = 2 specimens. (B) Median fluorescence intensity (MFI) ± SEM of NKG2A on KIR-negative and KIR-positive Eomeshi (open circles) and T-bethi (closed circles) stage 5a (CD94+CD16+) cells from indicated tissues. Fetal BM, n = 7; fetal liver, n = 8; fetal lung, n = 9; fetal spleen, n = 8; UCB, n = 2; adult spleen (Adult S.), 5 independent measurements made on n = 2 specimens. Significance determined using 2-way ANOVA with Bonferroni post-hoc tests. *P < 0.05, ***P < 0.001, ****P < 0.0001. ns, not significant.

