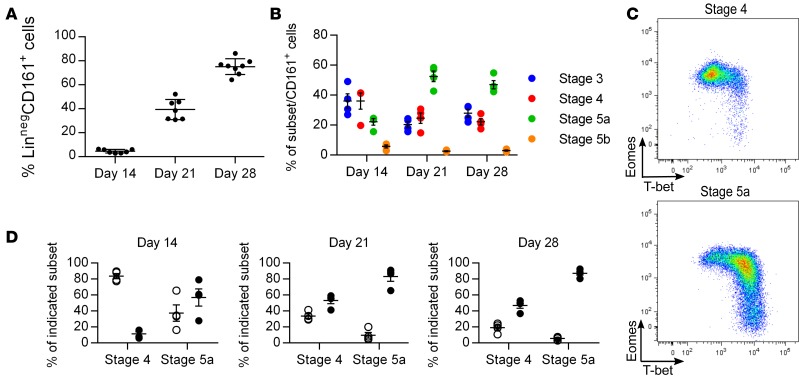
Figure 6. Eomeshi cells appear before T-bethi cells in an in vitro NK cell development culture system.
(A) Mean frequencies ± SEM of lineage-negative (Linneg: depleted of T cells, B cells, DCs, monocytes, granulocytes, erythroid cells, and CD34+ precursor cells) CD161+ cells on days 14, 21, and 28 of culture on EL08.ID2 cells. Each data point represents cells derived from a unique hematopoietic stem cell (HSC) source performed in 2 independent experiments. (B) Mean frequencies ± SEM of indicated stages of NK cell development on days 14, 21, and 28 of culture on EL08.ID2 cells; n = 4, representative of 2 independent experiments each performed with unique HSC sources. (C) Representative flow cytometry plot of intracellular Eomes and T-bet staining on indicated stages from day 14 of culture on EL08.ID2 cells. (D) Mean frequencies ± SEM of Eomeshi (open circles) and T-bethi (closed circles) cells from indicated stages on days 14, 21, and 28 of culture on EL08.ID2 cells; n = 4, representative of 2 independent experiments each performed with unique HSC sources.

