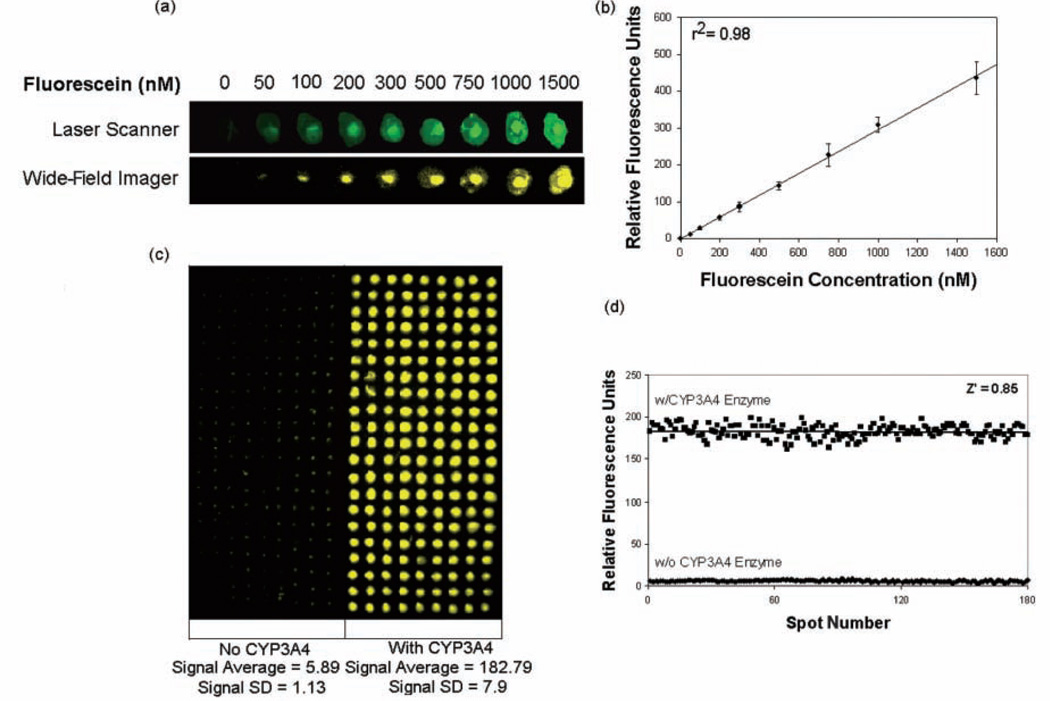
FIG. 2.
(a) Calibration assay with fluorescein. Representative 1×9 images of an array of 9 concentrations of the green fluorescent standard (ex: 485 nm, em: 535 nm; total spot volume 80 nL), as imaged with the wide-field imaging system and a laser scanner. (b) Calibration curve for fluorescein. Error bars on the graph represent standard deviations obtained from simultaneous measurements from 120 independent reaction spots per assay concentration (total spot content/microarray = 1080). (c) Wide-field image for 21×9 CYP3A4 reaction arrays with and without the enzyme present. (d) Z′ factor analysis for CYP3A4 alginate microarrays; 100 reaction elements (with enzyme) and 100 control elements (no enzyme) were analyzed simultaneously to yield a Z′ factor of 0.85 with a signal-to-noise ratio of ~31.

