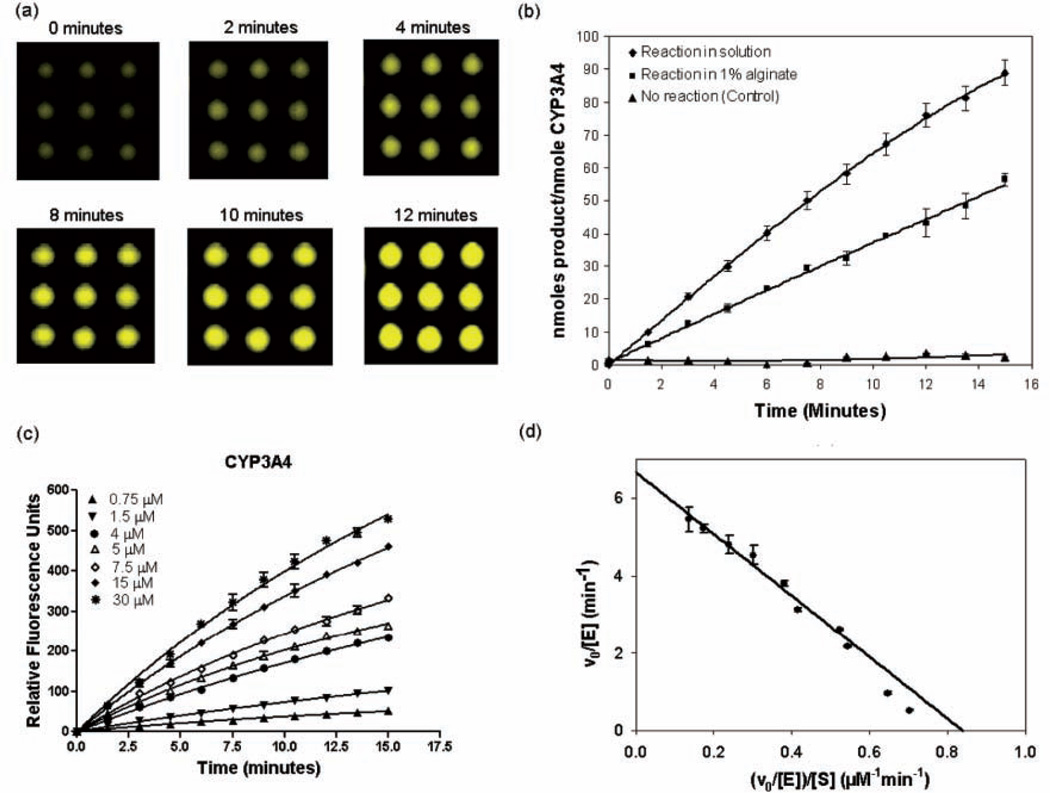
FIG. 4.
Reaction kinetics for CYP3A4 (10 nM) with dibenzoxymethylfluorescein (DBOMF) substrate on 1134-spot alginate microarrays (spot volume 80 nL, spot diameter 280 µm). (a) Images of a representative 3 × 3 section of the alginate array (DBOMF concentration 10 µM) taken with the wide-field imaging system. (b) Comparison of the progress of DBOMF substrate oxidation (concentration 10 µM) as a function of time in solution in 384-well plates (experiments conducted in triplicate) and on chip (100 independent spots arrayed and analyzed) in 1% alginate. Error bars represent standard deviations. (c) Initial rates obtained with different DBOMF concentrations (0.75-30 µM) for CYP3A4-catalyzed oxidation on the alginate chip. Error bars represent standard deviations from a 21 × 9 element array for each substrate concentration. (d) Eadie-Hofstee plot showing the fit to Michaelis-Menten kinetics for CYP3A4 encapsulated in 1% alginate with DBOMF substrate.

