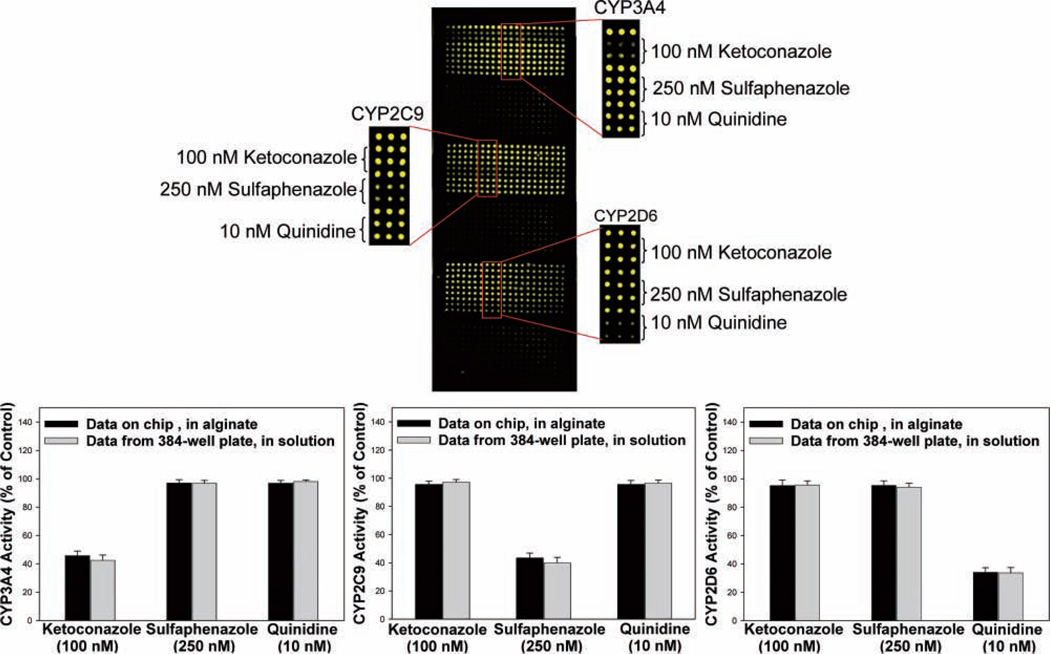
FIG. 5.
CYP450 inhibition on the microarray platform. (a) CYP3A4, CYP2C9, and CYP2D6 were immobilized on 3 different regions of the slide. For each of the 3 enzymes, a 21 × 9 array consisting of both reaction control rows (no inhibitor) and rows containing the inhibitory compounds (ketoconazole, sulfaphenazole, and quinidine) was printed. Interspersing the reaction blocks, three 21 × 9 arrays containing only buffer were printed to account for background fluorescence. Six snapshots with appropriate filters were taken of the slide, false colored in green, and reconstituted to give a single image. (b) Activity obtained for CYP3A4, CYP2C9, and CYP2D6 in the presence of inhibitors on the alginate microarray and in solution in 384-well plates, expressed as percentage of enzyme activity observed in the absence of any inhibitor. Standard deviations in fluorescent intensity across 21 independent reaction spots (alginate arrays) or triplicate wells (in solution) are represented as error bars.

