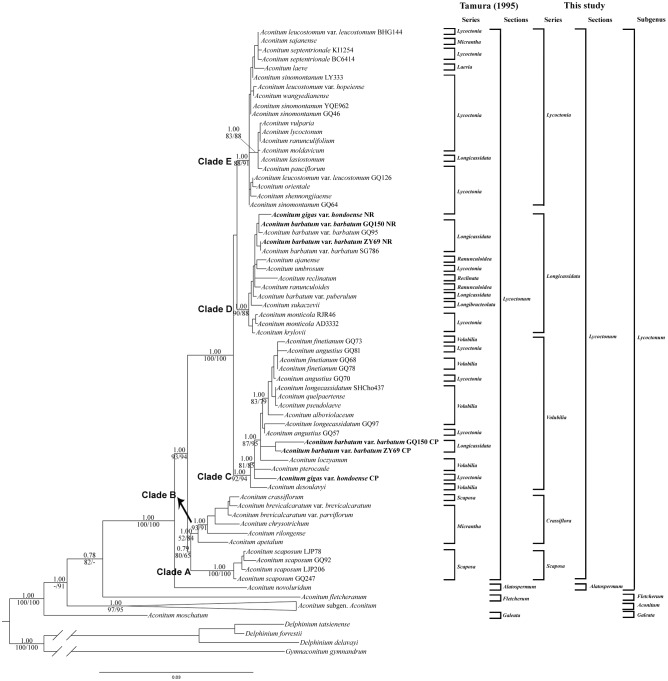
Fig 3. Phylogenetic relationships in Aconitum obtained from an ML analysis of the combined cpDNA and nrDNA dataset.
Numbers above branches are posterior probabilities; numbers below branches are bootstrap values for maximum parsimony/maximum likelihood analyses. “-” indicates that support is less than 50% bootstrap value. Tamura’s (1995) classification and our new classification of subgen. Lycoctonum are shown on the right. Accessions with different placements between the cpDNA tree and the nrDNA tree are indicated in bold. The clade of subgen. Aconitum has been collapsed for saving space (see S3 Fig for the complete topology).

