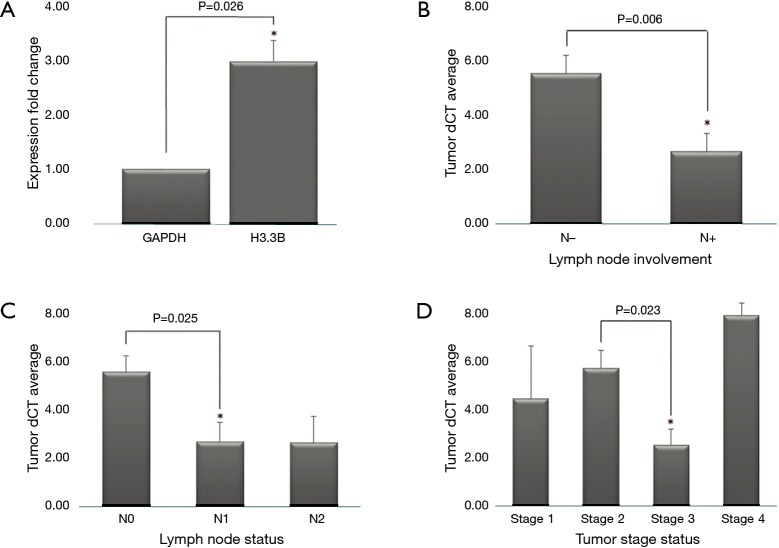
Figure 2.
Real-time PCR results of H3.3B gene for patients with colorectal cancer. (A) Comparing the level of H3.3B gene expression in normal and tumoral tissue; (B) associations between H3.3B expression and lymph node involvement; (C) associations between H3.3B expression and regional lymph node status; (D) associations between H3.3B expression and histopathological tumor staging. *, statistically significant, P<0.05.

