Figure 2.

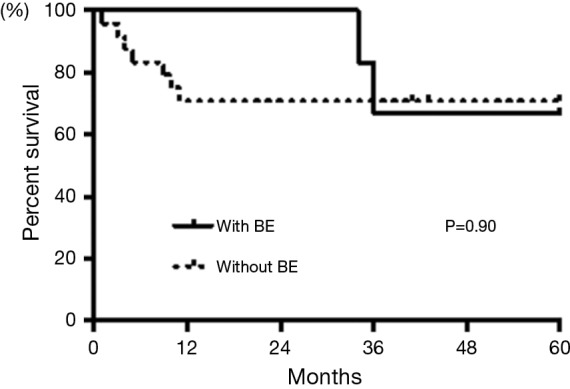
Survival curve of MPA patients with BE and without BE. Kaplan-Meier curve of survival of patients with BE (n=7, solid line) and patients without BE (n=24, dashed line) over 60 months. MPA, microscopic polyangiitis; BE, bronchiectasis.

Survival curve of MPA patients with BE and without BE. Kaplan-Meier curve of survival of patients with BE (n=7, solid line) and patients without BE (n=24, dashed line) over 60 months. MPA, microscopic polyangiitis; BE, bronchiectasis.