
Figure E8.
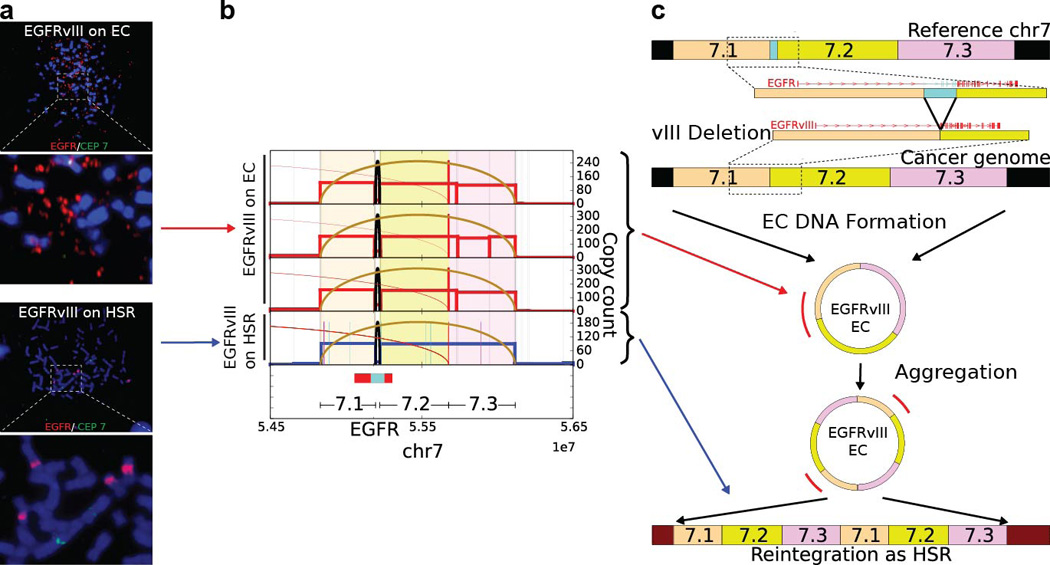
Fine structure analysis of EGFRvIII Amplification in Extrachromosomal or Chromosomal DNA in GBM39 Cells: a., FISH images revealed EGFR gene on ECDNAs (top) and HSRs (bottom) on different passes of the GBM39 cell line. Analysis of the HSR FISH images shows evidence of multiple integration sites on different chromosomes. b., Next generation sequencing of DNA from 4 independent cultures of GBM39 was used to analyze the fine structure of amplifications (Supplementary Material Section 4.3). In 3 biological replicates (rows 1 to 3) of these cultures, EGFRvIII was exclusively on ECDNA, while one of the later passage cultures (row 4) was found to contain EGFRvIII entirely on HSRs, with no detectable ECDNA. The DNA derived from different ECDNA cultures shows identical structure with some heterogeneity (p < 2.18 × 10⁻⁸ for all pairs), suggesting common origin. However, DNA derived from HSRs reveals a conserved structure that is identical to ECDNA structure (p < 1.98 × 10⁻⁵, Supplementary Material Section 2.4), possibly with tandem duplications. c., A possible progression of normal genome to cancer genome with EGFRvIII ECDNAs and amplification to a copy count of around 100 copies. The EGFRvIII ECDNAs possibly aggregate into tandem duplications and reintegrate into multiple chromosomes as HSRs such that 5–6 HSRs accommodate around 100 copies of EGFRvIII.