
Figure E9.
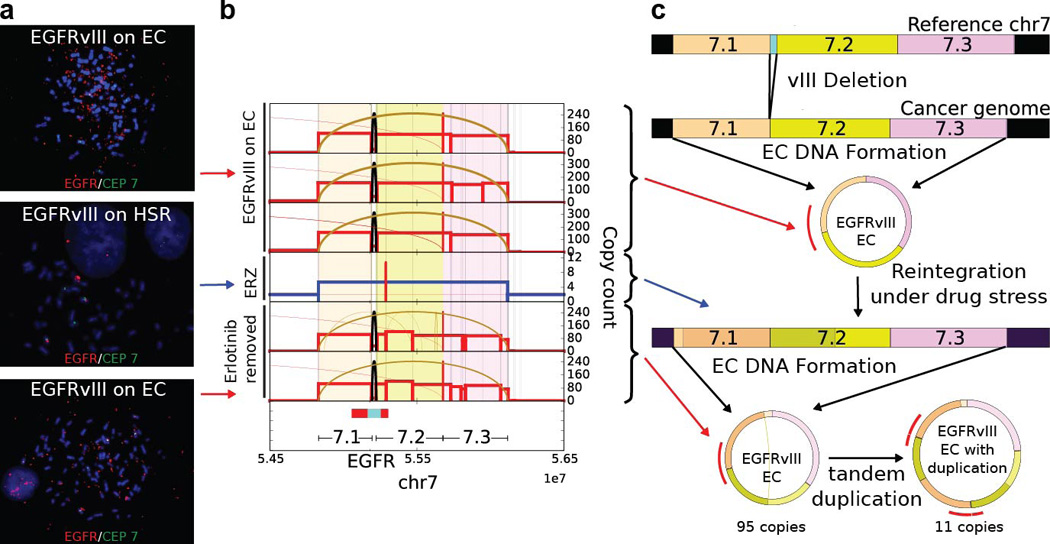
Fine structure analysis of EGFRvIII Amplification in Extrachromosomal or Chromosomal DNA in naive GBM39 cells and in response to Erlotinib Treatment (ERZ) and Drug Withdrawal: a., FISH images of naive GBM39 cells, in response to Erlotinib Treatment (ERZ) and Drug Withdrawal displayed EC amplification, HSR amplification and EC amplification respectively (top to bottom). b., Next generation sequencing of DNA from 6 independent cultures of GBM39 was used to analyze the fine structure of amplifications (Supplementary Material Section 4.3). Average copy numbers of amplified intervals as determined from sequencing analysis in naive samples (biological replicates in rows 1 to 3): 110 to 150, ERZ sample (row 4): 5.4 and Erlotinib removed (biological replicates in rows 5 and 6): 100–105. All three categories show similar fine structure indicating common origin (Methods). Erlotinib removed replicates show additional rearrangements and heterogeneity as compared to naive samples. c., Cytogenetic and sequencing progression suggests the EGFRvIII ECDNAs in naive cells get reintegrated into HSRs after drug application and the copies in the HSRs break off from the chromosomes again to form ECDNAs with copy count similar to naive cells. Drug removed samples also show additional heterogeneity in structure.