
Figure E2.
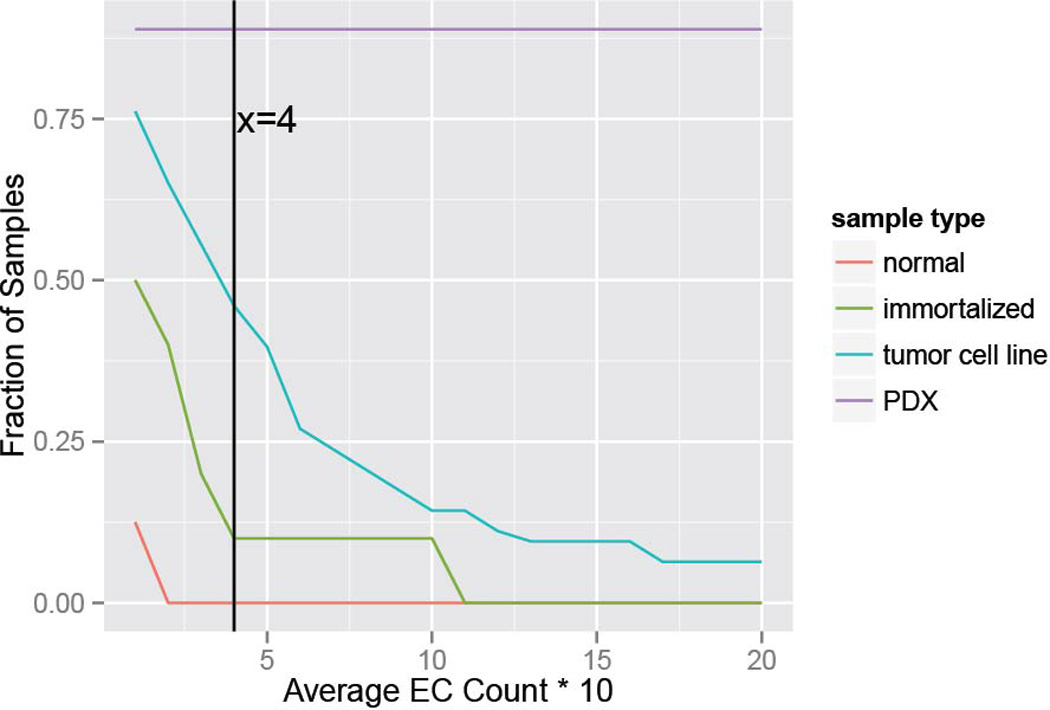
Alternative analysis of ECDNA presence according to varying criteria, stratified by sample type: Samples with a minimum number of ECDNA per 10 metaphases in average shown in x-axis are classified ECDNA-positive, and their fraction is displayed on the y-axis. The vertical line at x=4 shows that for a minimum of 4 ECDNA per 10 metaphases on average, 0% of normal, 10% of immortalized, 46% of tumor cell line and 89% of PDX samples are classified as ECDNA positive.