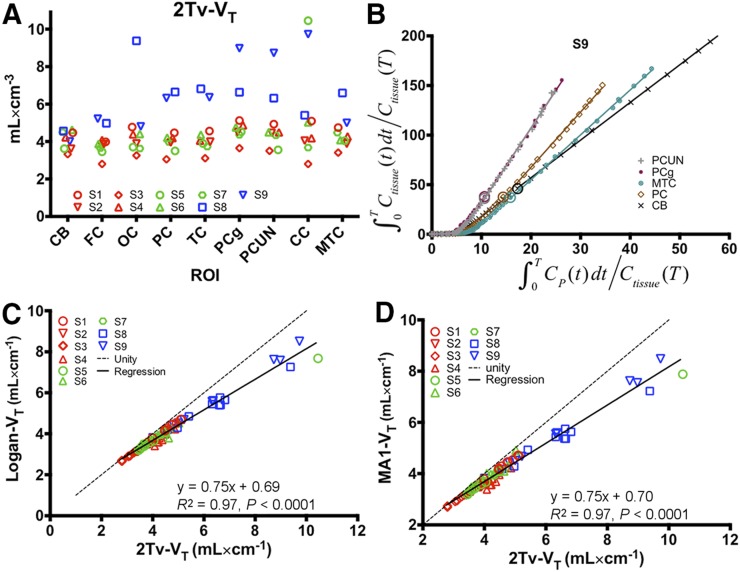
FIGURE 3.
Results from arterial input function–based analyses. (A) Regional VT estimates from 2Tv compartmental model in cerebellum (CB), frontal cortex (FC), occipital cortex (OC), parietal cortex (PC), temporal cortex (TC), posterior cingulate gyrus (PCg), precuneus (PCUN), subject-specific region of interest (ROI) in corpus callosum (CC), and mesial temporal cortex (MTC). (B) Demonstration of Logan plot linearization in MCI subject (subject 9) for estimation of VT. Large circles depict 30-min t* point. Axes were truncated to enhance visualization of higher binding regions. (C and D) Comparison of 2Tv and graphical estimates of VT using either Logan analysis (C) or MA1 (D). In A, C, and D, red markers designate control subjects, green markers correspond to TBI subjects, and blue markers indicate MCI subjects.

