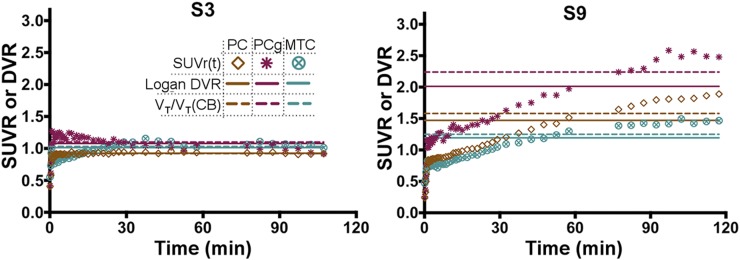
FIGURE 5.
SUVR time courses (symbols), DVR estimated directly by Logan regression with reference region inputs (horizontal solid lines), and DVR estimated indirectly by from compartmental modeling with arterial inputs (horizontal dashed lines) for control subject (subject 3) and MCI subject (subject 9). CB = cerebellum; PC = parietal cortex; PCg = posterior cingulate gyrus; MTC = mesial temporal cortex.

