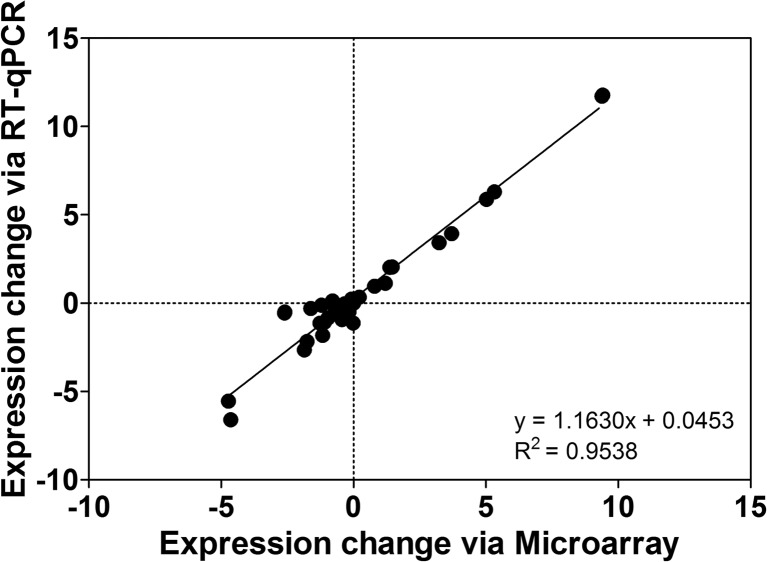
Fig. 7.
Comparison of expression values for select transcripts assessed via array analysis and quantitative real-time PCR. Expression ratios are relative to values in wild-type (WT) hearts treated with normal saline (NS) and are thus shown for WTs treated with LPS for 24 h (WT LPS) and A2AR KO hearts untreated (KO NS) or treated with LPS (KO LPS). Data are means ± S.E.M, n = 6–8/group

