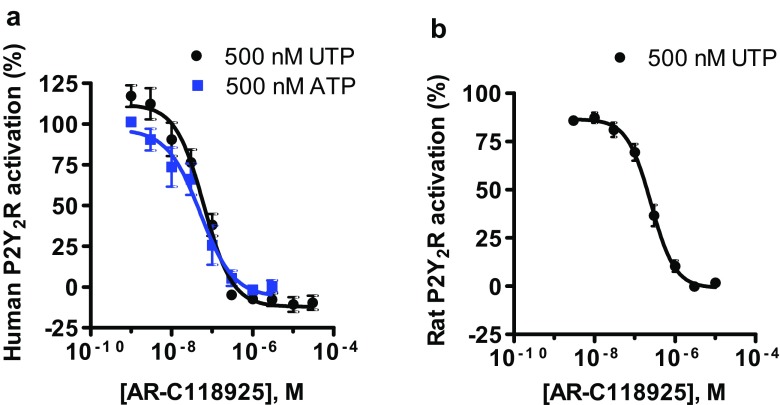
Fig. 2.
Dose-response curves of AR-C118925 (3) on the a human and b rat P2Y2 receptors in recombinant 1321N1 astrocytoma cells determined using the calcium mobilization assay with UTP (black circles) or ATP (blue squares) as agonists. The concentrations of the agonists used correspond to their EC80 values. For the human P2Y2 receptor (a), IC50 values of 0.0721 ± 0.0124 μM vs. 500 nM UTP and 0.0574 ± 0.0196 μM vs. 500 nM ATP were determined. For the rat P2Y2 receptor (b), an IC50 value of 0.291 ± 0.047 μM was obtained vs. 500 nM UTP. Data points are means of 6–8 independent experiments performed in duplicates ± standard error of the mean (SEM)

