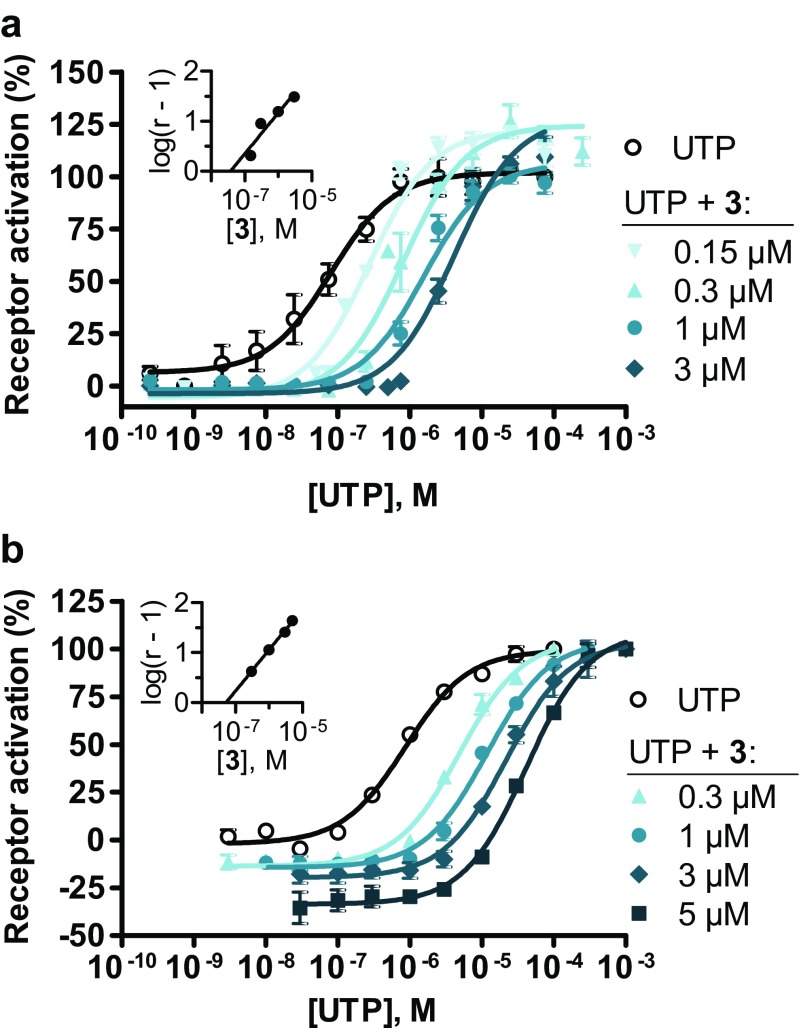
Fig. 5.
Dose-response curves of UTP (1b) on the human P2Y2 receptor following pre-incubation with different, fixed concentrations of AR-C118925 (3), determined using a the calcium mobilization assay and b the β-arrestin assay. Data points represent mean values ± SEM of three to six separate experiments performed in duplicates. Where no error bar is apparent, the SEM is too low to be visible. The inserts show the respective Schild plot: a slope = 0.816 and pA 2 = pK B = 10–7.43, corresponding to 37.2 nM. b Slope = 0.817 and pA 2 = pK B = 10–7.29, corresponding to 51.3 nM. The EC50 values and maximum receptor activation for (a) and (b) are shown in Tables 2 and 3 in the Supporting Information. r concentration ratio of the antagonist AR-C118925

