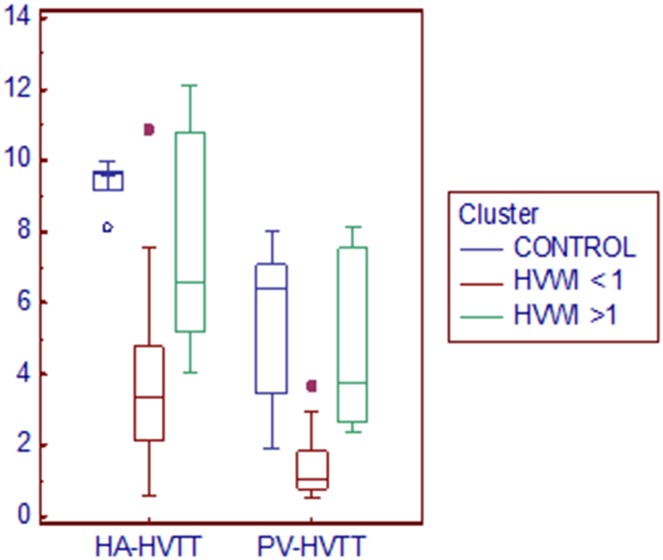
Fig. 3.
Clustered multiple variables (HA-HVTT and PVHVTT) graph. Box-and-Whisker plots of the two variables for three clusters. The middle line represents the median. A line extends from the minimum to the maximum value, excluding “outside” and “far out” values which are displayed as separate points. Normal volunteers and cirrhotics with HVWI >1 showed very similar transit times

