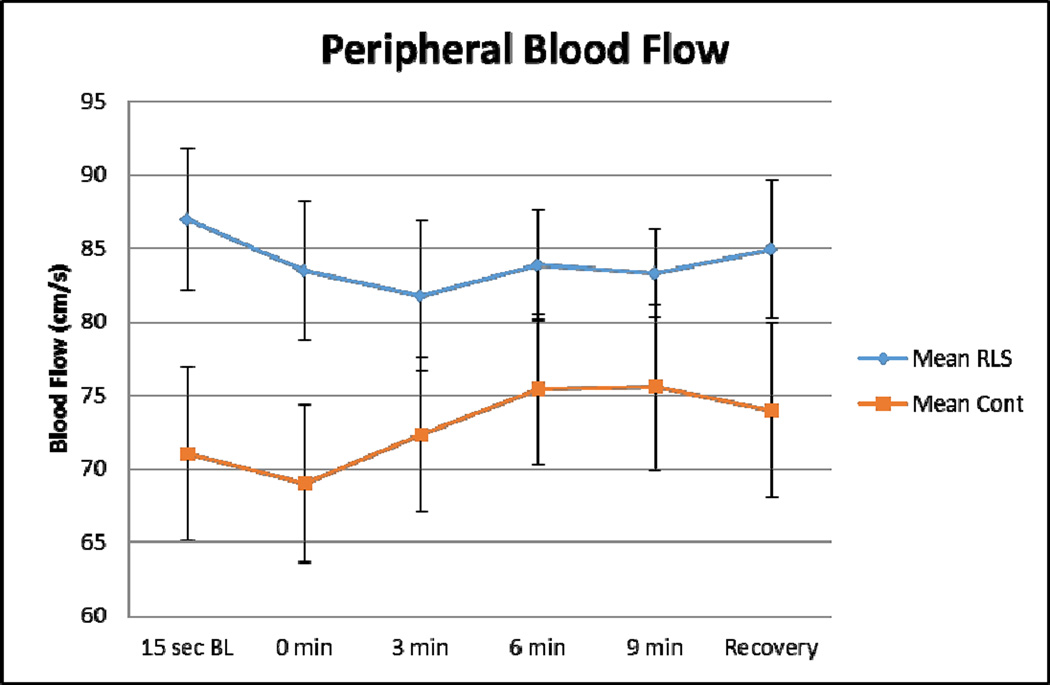
Figure 6. Alterations in Femoral Artery Blood Flow.
This figure demonstrates the femoral artery blood flow in RLS (blue) and control (orange) subjects. Error bars are standard error of the mean. n=18 (9 RLS; 9 age- and gender-matched controls). Baseline femoral artery blood flow is increased 22.5% in RLS subjects. RLS subjects demonstrate only a 1.7% increase in blood flow following exposure to hypoxia, whereas control subjects demonstrate a 7.2% increase in blood flow following hypoxia. (unpublished data)

