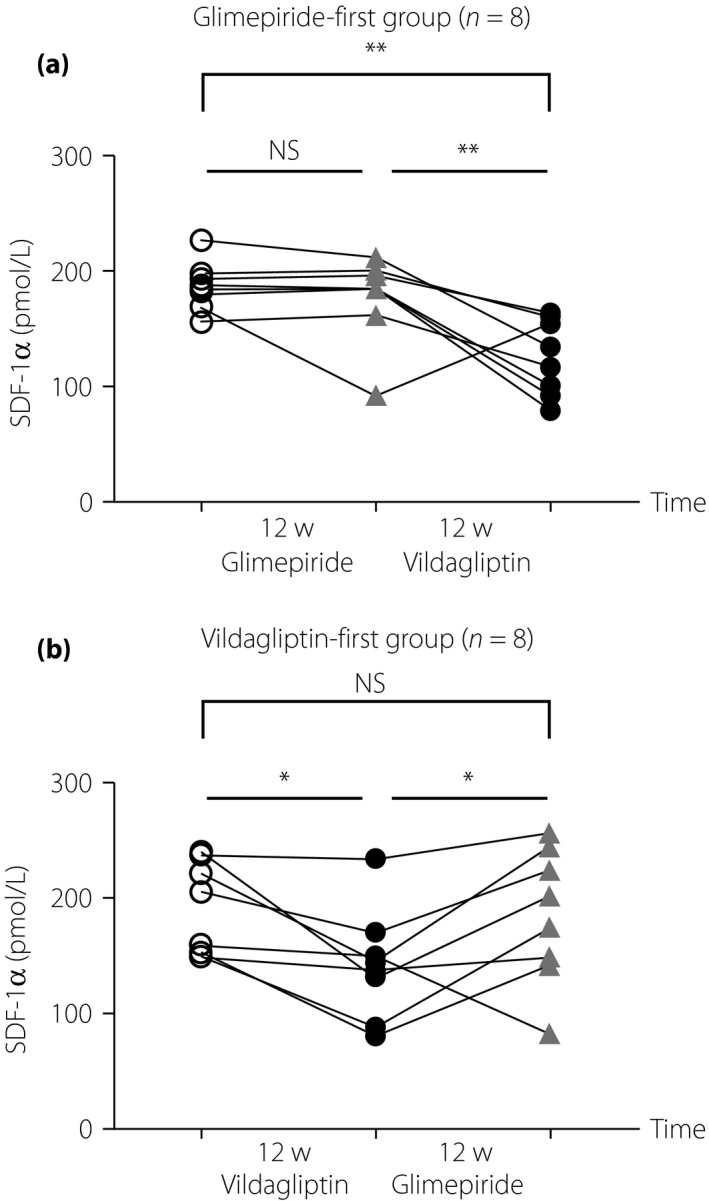
Figure 1.

Changes of stromal cell‐derived factor‐1α (SDF‐1α) according to the treatment order. Changes of serum SDF‐1α are shown separately according to the first‐administered agent. (a) Glimepiride‐first group (n = 8). (b) Vildagliptin‐first group (n = 8). Open circles show the levels before any treatment, grey triangles, after glimepiride, and solid circles, after vildagliptin treatment. Means of the levels were significantly different by the repeated measures anova, and then post‐hoc Tukey's multiple comparison test was carried out. *P < 0.05; **P < 0.005. 12w, 12 weeks; NS, no significant difference.
