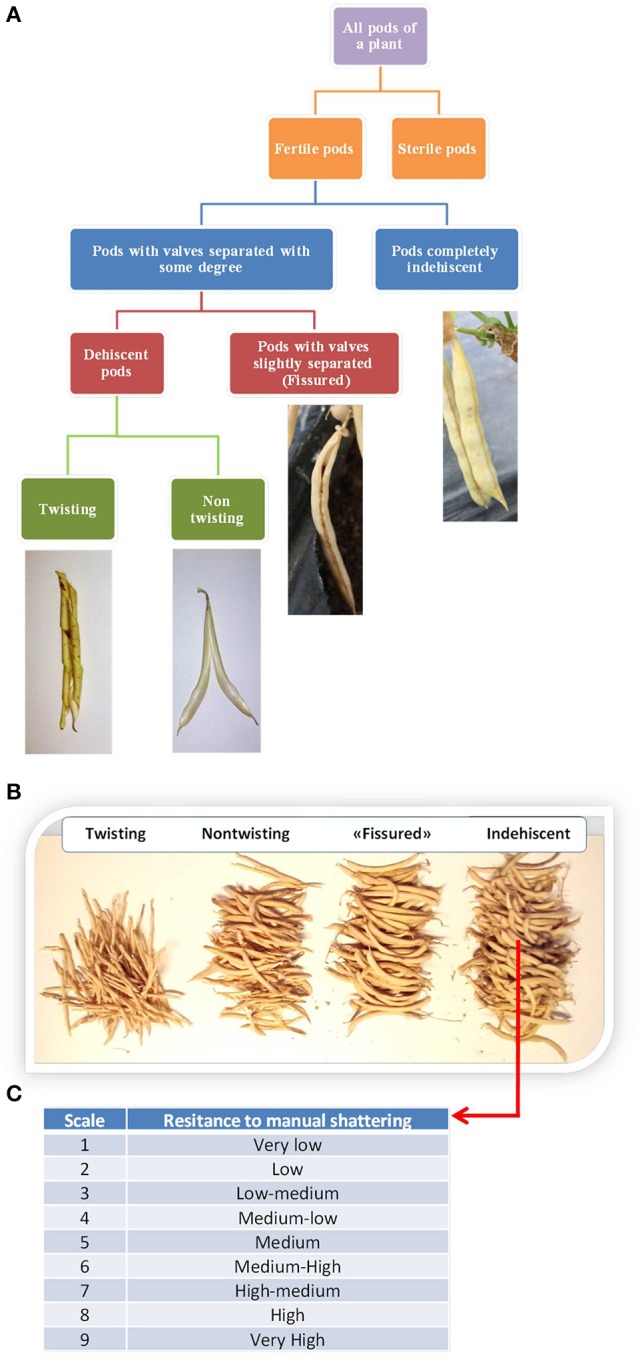
Figure 2.

(A) Flow diagram of the methods used to classify the pods produced by each plant based on the shattering trait. (B) Manual count of the pods produced by the individual plants. (C) Classification of the resistance to “manual shattering” of the pods, into discrete scores from 1 (very easy) to 9 (very difficult) (see also Supplementary videos).
