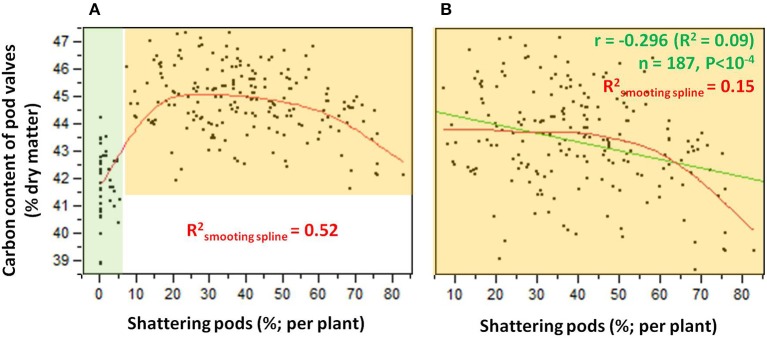
Figure 6.
(A) Relationship between carbon contents and levels of shattering. Green shading, individuals for which shattering was <7.14%; orange shading, individuals for which shattering was ≥7.14%. (B) Relationship between carbon contents and shattering levels excluding individuals with low or no shattering. R2 given for smoothing spline (λ = 10,000) (red) and linear fit (green).

