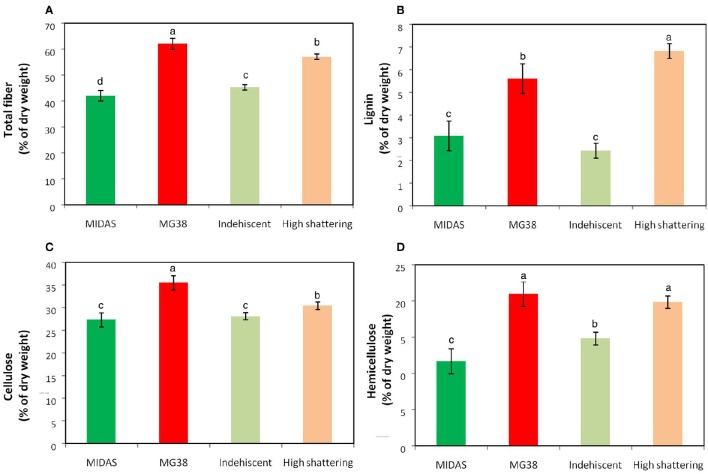
Figure 7.
Results of cell-wall analysis. (A) Total fiber, (B) Lignin, (C) Cellulose and (D) Hemicellulose composition. Comparisons between parental lines MIDAS (indehiscent) and MG38 (highly dehiscent), and between nonshattering and highly shattering introgression lines. Each group of introgression lines comprised 12 individuals. The group of highly shattering introgression lines had percentages of shattering pods >MG38 (>65%). Green, MIDAS; red, MG38; light green, non-shattering introgression lines; light red, highly shattering introgression lines. Columns with different letters have significantly different means (P < 0.05; Tukey-Kramer multiple comparison tests).

