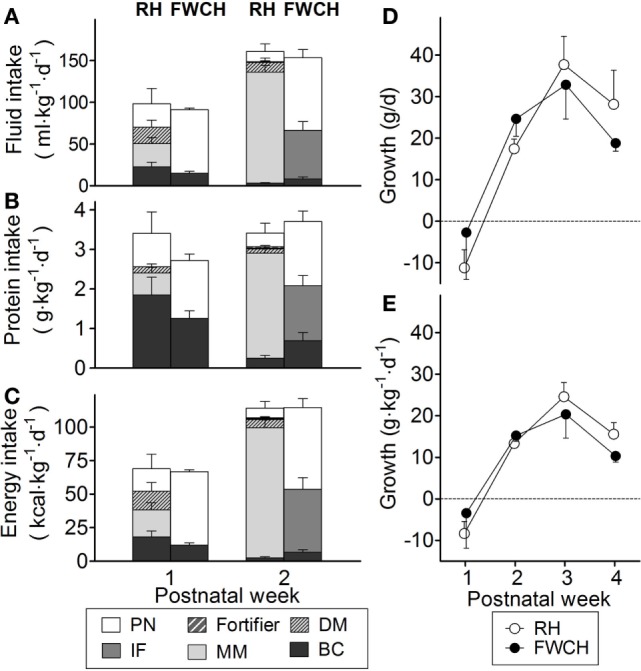
Figure 2.

Intake of fluid (A), protein (B), and energy (C) from different nutritional sources during the first 2 weeks of life, and growth velocity during the first 4 weeks of life, expressed as grams per day (D) and grams per kilogram per day (E). FWCH, Foshan Women’s and Children’s Hospital; RH, Rigshospitalet. Panels (A–C) show values for bovine colostrum (BC, black bars), mother’s own milk (MM, light gray bars), human donor milk (DM, light gray bars with hatching), infant formula (IF, dark gray bars), human milk fortifier (HMF, dark gray bars with hatching), and parenteral nutrition (PN, white bars). Panels (D,E) show values for RH (white circles) and FWCH (black circles). Values are presented as mean ± SEM for RH (n = 6–7) and FWCH (n = 4–5).
