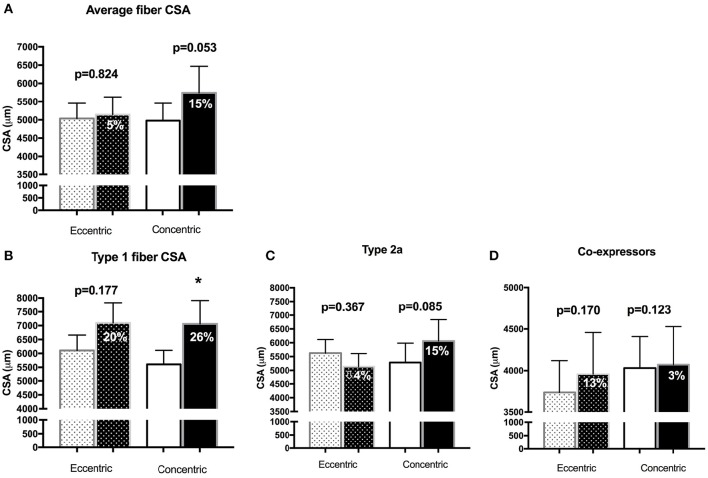
Figure 4.
Morphometrical analysis of fiber cross-sectional areas (μm2) for (A) the average fiber (not taking fiber type into account); (B) pure Type 1 fibers; (C) pure Type 2a fibers; (D) fibers that express more than one myosin heavy chain isoform in the Eccentric and Concentric group. The darker shaded bars represent the post-training value, with the percentage reflecting the mean of the percent change per subject Bar values are means ± SEM. *p < 0.05.

