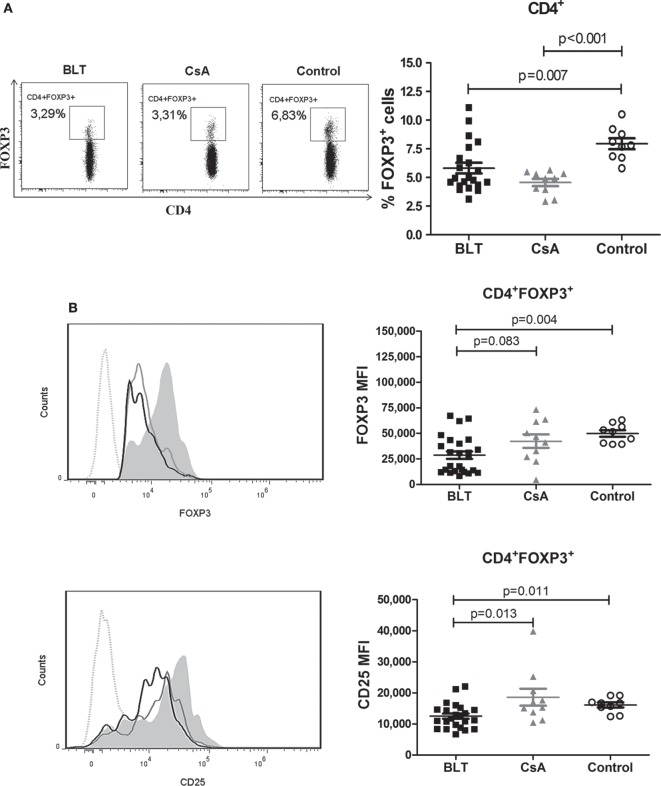
Figure 2.
CD4+ T cells from BLT-treated patients show a diminished frequency of FOXP3+ subset with reduced levels of FOXP3 and CD25. (A) A reduced frequency of CD4+FOXP3+ T cells was found in patients under BLT (n = 21) and CsA (n = 10) treatment compared to controls (n = 9). Lefts panels show representative dot plots from patients and controls. (B) Levels of FOXP3 and CD25 expression within the CD4+ subpopulations, were calculated as mean fluorescence intensity (MFI), showing a significant reduction in BLT-treated patients compared to CsA and control group. Left panels show representative histograms from BLT (black solid line), CsA (gray solid line), and control (filled histogram) individual; dotted line denotes fluorescence minus one control. MFI values from each individual were calculated by subtracting the MFI values of the non-expressing subpopulation for each marker from the corresponding expressing subpopulation. Statistical analysis was performed using non-parametric Mann–Whitney test, two tailed. BLT, belatacept; CsA, Cyclosporine A. Control group was composed by healthy individuals.

