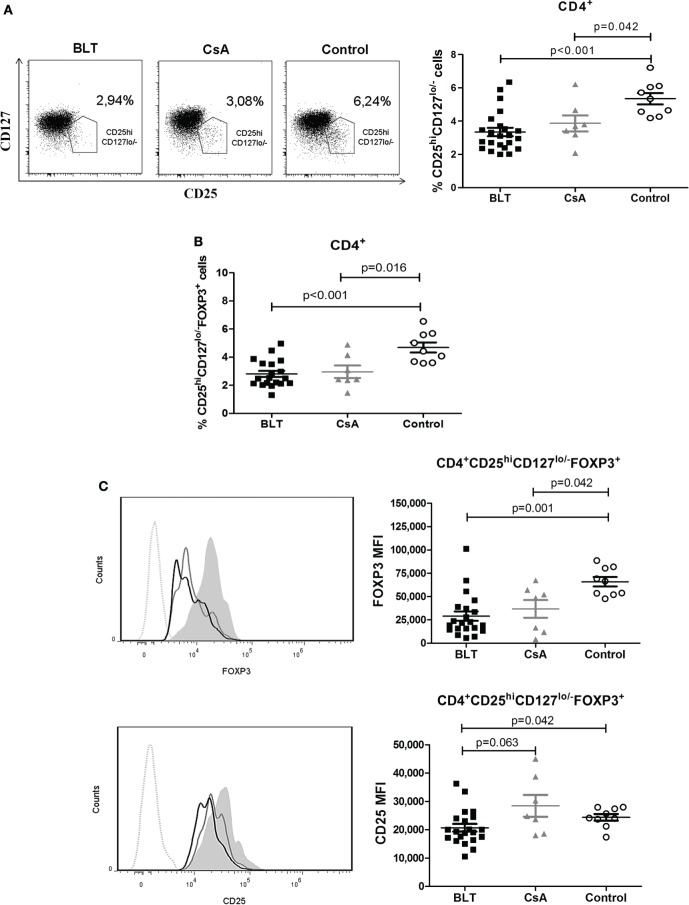
Figure 3.
Peripheral CD4+CD25hiCD127lo/−FOXP3+ T cells [regulatory T cells (Tregs)] from kidney transplant patients showed a reduction in frequency and expression levels of FOXP3. (A) Reduced frequency of CD4+CD25hiCD127lo/− T cells in long-term kidney transplant patients (BLT = 12 and CsA = 7) versus controls (n = 9). Right panels show representative dot plots from patients and controls. (B) Reduction in the percentage of CD4+CD25+CD127lo/−FOXP3+ T cells in compared to controls. (C) Expression of markers characteristic of the Treg phenotype demonstrates a significant reduction of FOXP3 and CD25 in Tregs from BLT-treated patients. Left panels show representative histograms from BLT (black solid line), CsA (gray solid line), and control (filled histogram) individual; dotted line is a fluorescence minus one control. Mean fluorescence intensity (MFI) values from each individual were calculated by subtracting the MFI values of the non-expressing subpopulation for each marker from the corresponding expressing subpopulation. Statistical analysis was performed using non-parametric Mann–Whitney test, two tailed. BLT, belatacept; CsA, Cyclosporine A; control group was composed by healthy individuals.

