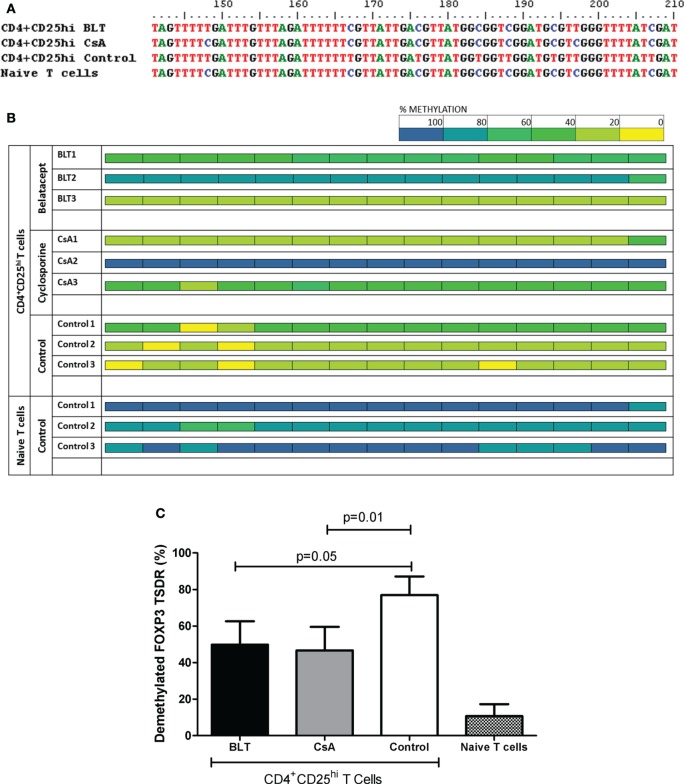
Figure 8.
Altered methylation in the regulatory T cell (Treg) FOXP3 TSDR from kidney transplant patients. Sequence analysis of the TSDR region of the FOXP3 gene from BLT, CsA, or controls (three male individuals per group, five clones per individual). (A) After bisulfite treatment, all demethylated CpG cytosines (blue) convert to thymines (red), as seen with CD4+CD25hi Tregs from the control (CD4+CD25veryhi gated). By contrast, naïve T cells display a completely methylated TSDR and were used as negative control. Data from representative individuals from each group are shown. (B) The panel shows the methylation status of the TSDR FOXP3 in the indicated T cells from the three evaluated groups (three individuals per group). Each square represents one CpG analyzed, data are presented as mean percentage methylation of five clones per individual. Methylation color code ranges from yellow (0% methylation) to blue (100% methylation) according to the color scale (upper right). (C) Percentage of demethylation from each evaluated group, represented as the ratio between the numbers of demethylated cytosines and the total number of sequenced CpG sites within the TSDR region.

