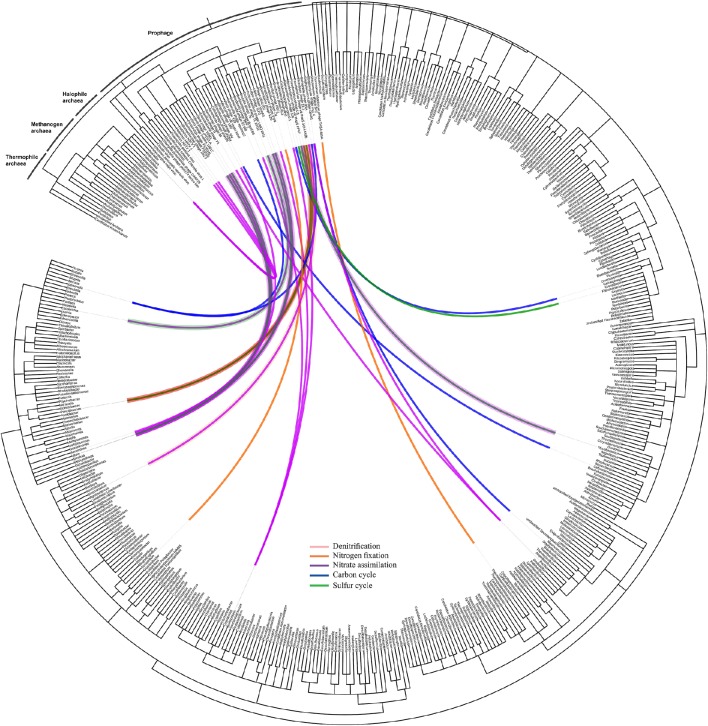
Figure 5.
Network of prophage and their prokaryotic hosts. The dendrogram is based on NCBI taxonomy, showing the phage taxa that were found as integrated prophages in the bacteria contigs with respect to their hosts. The network is showing the interaction of the prophages and their prokaryotic hosts and the color of the line indicates the nutrient cycle that these prokaryotic hosts are involved in and, consequently, the susceptibility of these cycles due to presence of infecting temperate phages.

