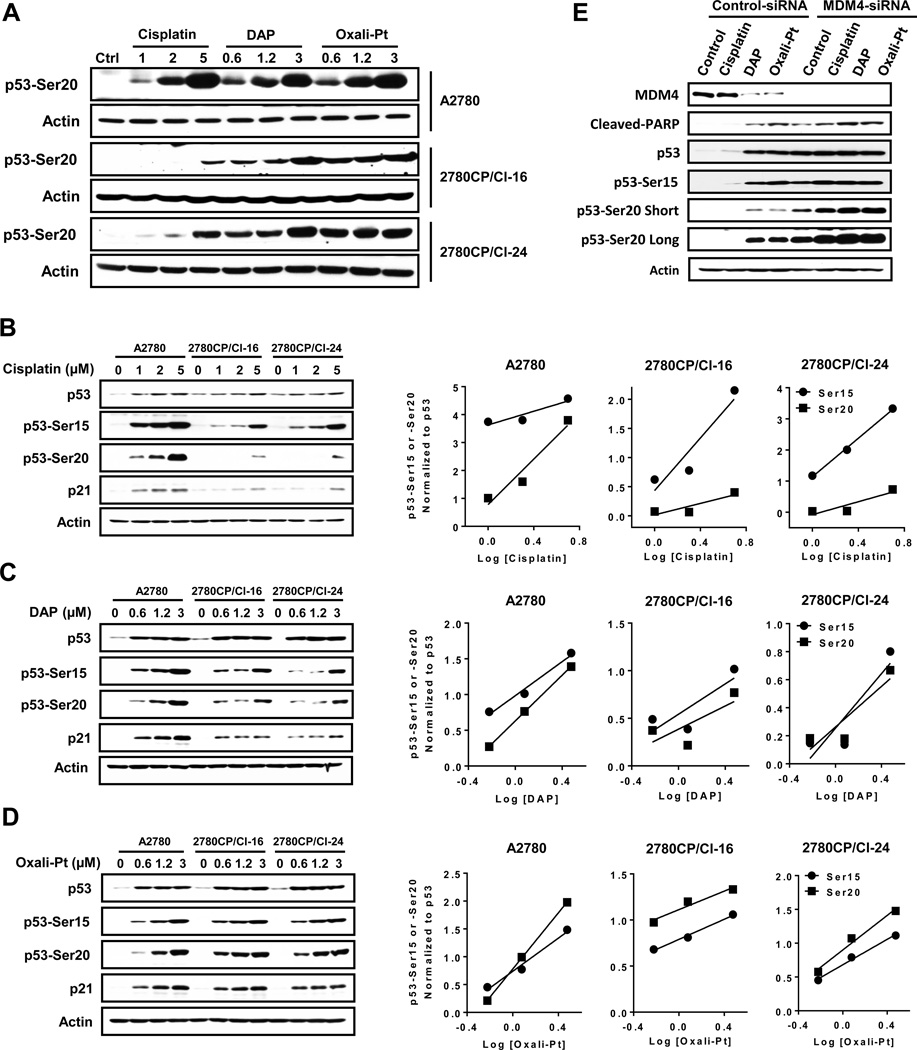
Figure 5.
Post-translational phosphorylation of p53 by platinum drugs in ovarian tumor cells. A2780, 2780CP/Cl-16 and 2780CP/Cl-24 cells were treated with increasing concentrations of cisplatin, DAP or oxaliplatin for 24 hours, and lysates then prepared for Western blot analysis using the Ser20 phospho-specific antibody for direct comparison of effects of the three drugs in each cell line (A). The lysates from cells similarly treated with cisplatin (B), DAP (C) or oxaliplatin (D) were analyzed using the indicated antibodies to compare the effects of each drug in the three cell lines. The Ser15 and Ser20 signals in the immunoblots were quantified by densitometry and the ratios of Ser15:total p53 and Ser20:total p53 determined and plotted against concentration using linear regression analysis. In an independent study, 2780CP/Cl-24 cells transfected with control- or MDM4-siRNA were then treated with cisplatin, DAP or oxaliplatin for 24 hours. Cells were then harvested and subjected to Western blot using the indicated antibodies (E). In some cases, “short” and “long” exposures were used to visualize the proteins.

