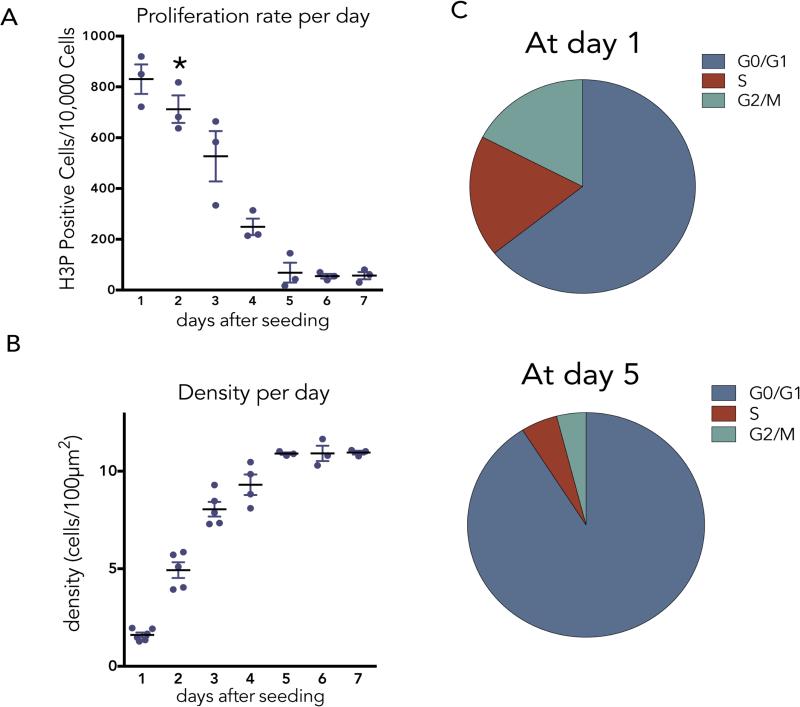
EDFigure 1. Profile of epithelial cell proliferation and cell density over time.
(A) Daily proliferation rates of MDCK cells, as measured by phospho-Histone H3 (H3P) immunostaining, where asterisk indicates when confluence is reached (n=3). Cell division slows but does not stop at day 5. (B), Cell density plateaus by 5 days of growth when cells reach ~11/1000μm2 (n=3). All values are the mean of ten fields from 3 independent experiments with error bars as s.e.m. (C) Cell cycle profiles by FACS at day 1 and day 5 after plating at high density.

