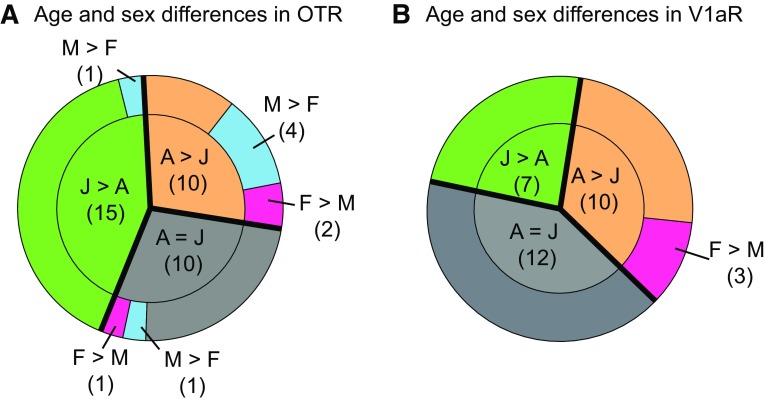
Fig. 2.
Overview of age and sex differences in OTR and V1aR binding densities in the rat brain. Age differences (green and orange) are more prevalent than sex differences (blue and pink) in both OTR binding density (a) and V1aR binding density (b). Data represent proportions of brain regions that significantly differ by age and sex for OTR or V1aR determined by two-way ANOVA with FDR correction for multiple comparisons. The number of brain regions is indicated in parentheses. J juveniles, A adults, M males, F females

