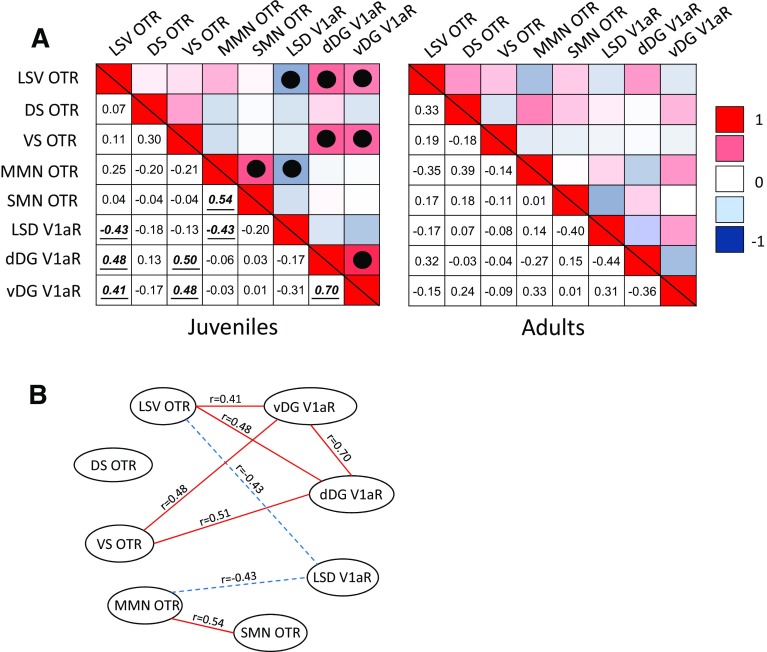
Fig. 8.
Patterns of covariation between OTR and V1aR binding densities within a network of brain regions involved in social and spatial memory. a Heat maps are shown for juveniles (left) and for adults (right) of both sexes combined. The upper and lower triangle in each heat map shows the same data. The hue in the upper triangle represent the strength of the correlation and color indicates the direction of the correlation (red = positive; blue = negative). The numbers in the lower triangle represent the correlation coefficient. Significant correlations are marked with a solid dot in the upper triangle and bolded, italicized, and underlined in the lower triangle. Note the presence of eight significant correlations in this network in juveniles and none in adults. b Visualization of the network in juveniles showing the correlation coefficients with solid lines indicating positive correlations and dashed lines indicating negative correlations. Significance set at p < 0.05

