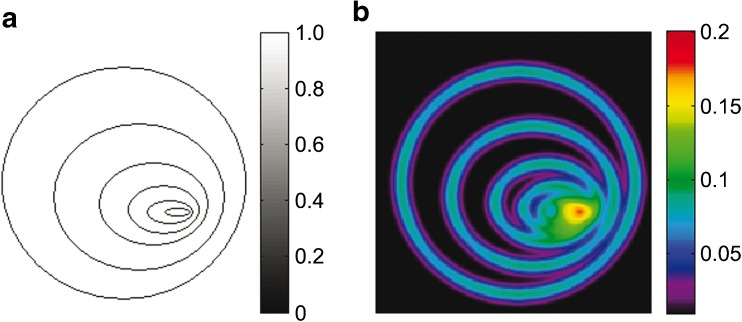
Fig. 1.
Illustration of the SWI - local image variance (LIV) calculation. (A) The left image shows a simulation of blood vessels (hypointense structures on a hyperintense background) as typically detected by SWI. As illustrated in this image, the density of these simulated blood vessels increases from the left to the right. Such an increasing density of blood vessels is typically observed in high-grade gliomas. (B) The right image illustrates the corresponding colour-coded SWI-LIV map, where LIV values increase with the density of blood vessels. The LIV values reach their maximum in the area with the highest density of the blood vessels. Note, the simulated SWI image (left image) is a binary image and includes only the values 0 and 1, resulting in SWI-LIV values that are not comparable to patient data

