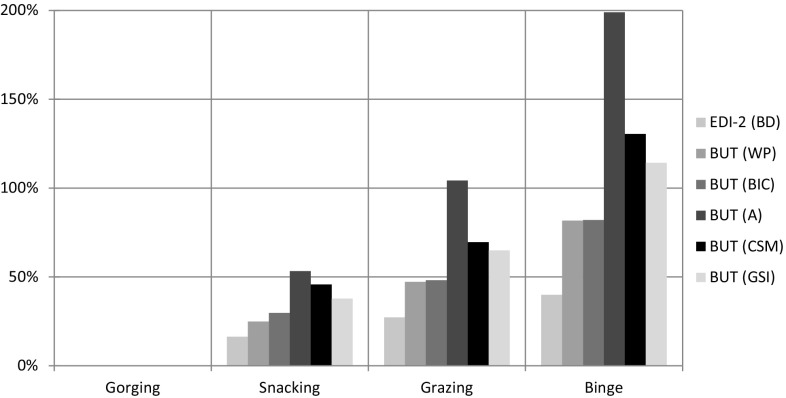
Fig. 4.
Body image. Bar chart detailing the percentage increase of each mean value (A avoidance, CSM check self monitoring, GSI global symptom index, BIC body image concern, WP weight phobia, EDI-2BD body dissatisfaction) from minimum (Gorging) to maximum (Binge); e.g. Binge has BUT Avoidance mean value increased approximately +200 % (three times) compared with Gorging

