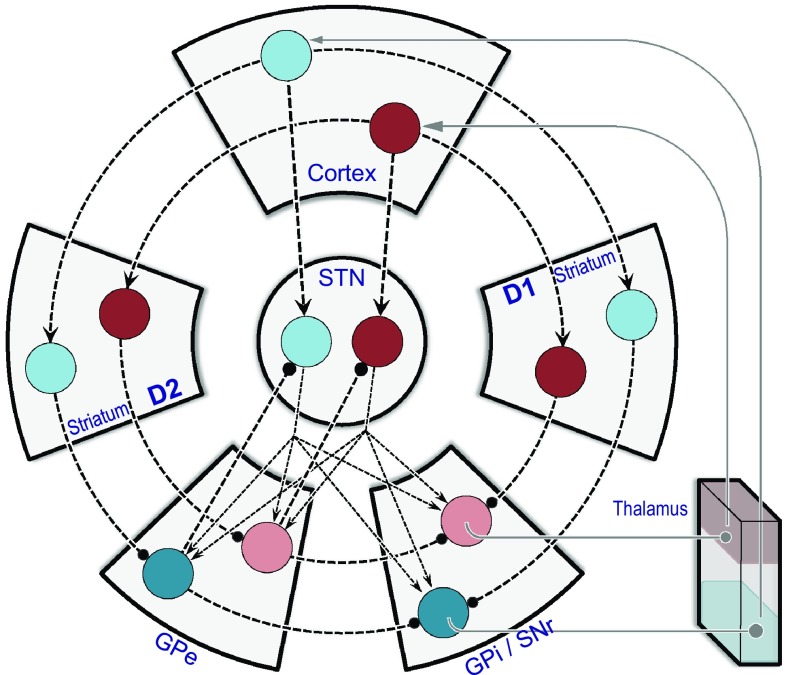
Fig. 4.
Architecture of a computational BG network model. The circuit diagram shows two microchannels, indicated by connections amongst two sets of blue or red discs, specific for two alternative actions (the actual computational implementation of the model used six microchannels). The format is similar to Figs. 2 and 3, with some adjustment to accommodate the additional wiring. For instance, D1 (dSPN) and D2 (iSPN) components of the striatum are here represented by separate blocks. Each disc denotes a population of neurons, modelled by its normalized mean firing rate (dark for highly active, pale for less active). The ‘red’ action is the one selected by the model in the state illustrated. Note that most connections are channel specific (1 disc: 1 disc); these include the graphically circular pathways between cortex, striatum, GPe and GPi/SNR, as well as both sets of inputs to the STN at the centre (from cortex, and from GPe). Competition between the ‘blue’ action and the ‘red’ action is mediated by the outputs from the STN that are one-to-many (1:2 in the diagram; 1:6 in the computational implementation). This representation is adapted from Gurney et al. (2015), but the network architecture is equivalent to earlier implementations of the model (Gurney et al. 2001a, b; Humphries et al. 2006). Outputs from GPi/SNr to thalamus and from thalamus to cortex are shown for completeness; thalamic activity was not part of the model. Conventions as for Fig. 2

