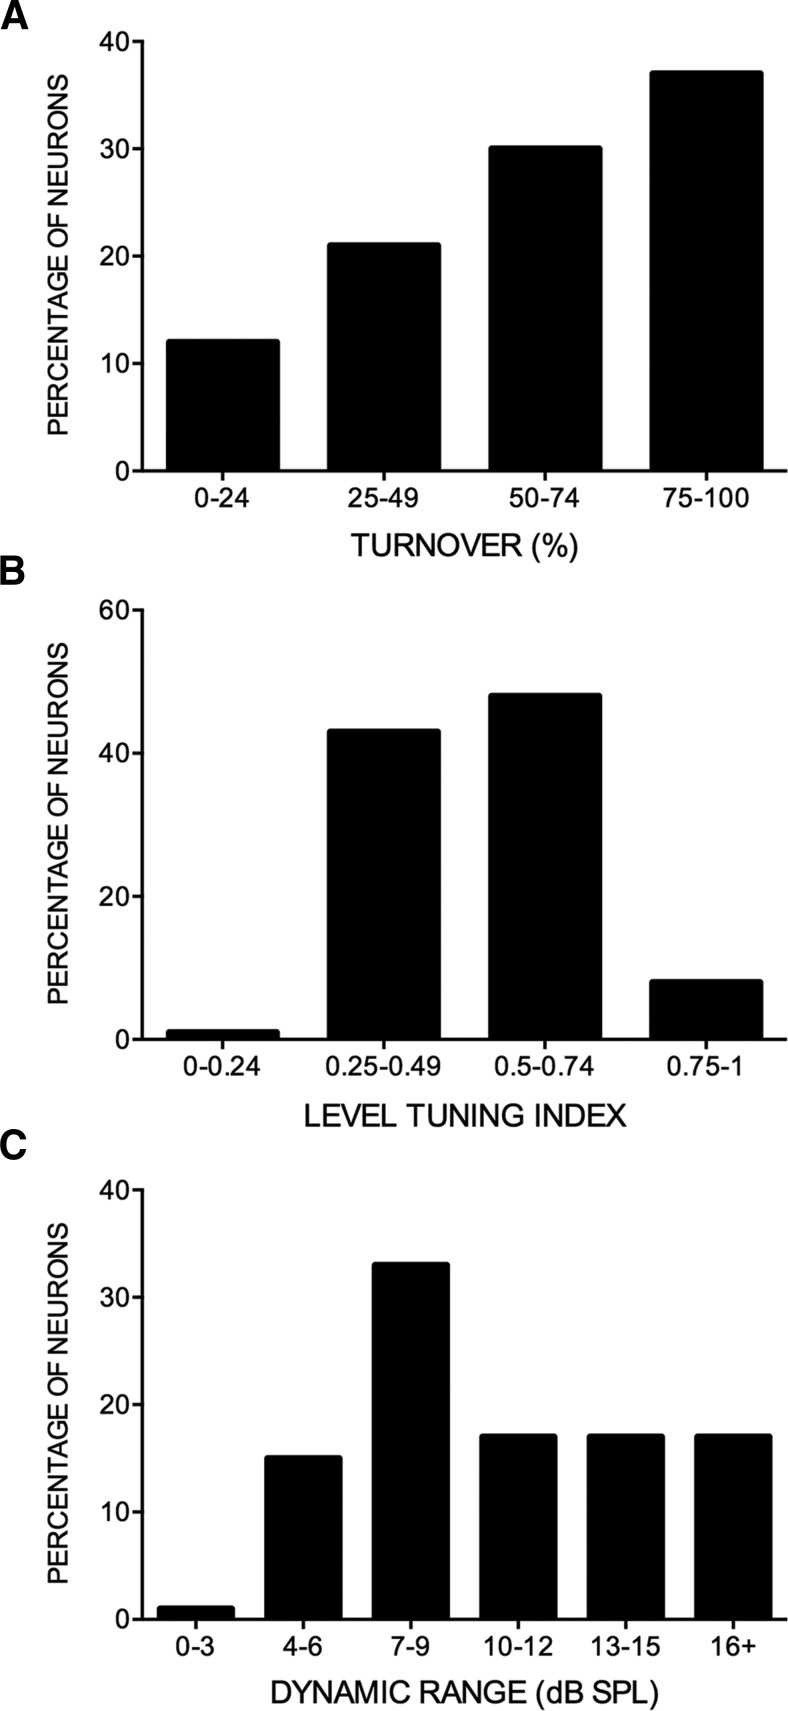
Figure 5.
Distribution of sound level selectivity measures in the FMSR of the pallid bat auditory cortex (n = 287 neurons). A, %TO distribution from least selective (0-24.9%) to most selective (75-100%). B, Distribution of LTI from least sharply tuned (0-0.2499) to most sharply tuning (0.7500-1.000). C, DR; the range of sound levels over which the response of the neuron increased from 10% to 90% of maximum response. All responses were recorded with downward FM sweeps as stimuli.

