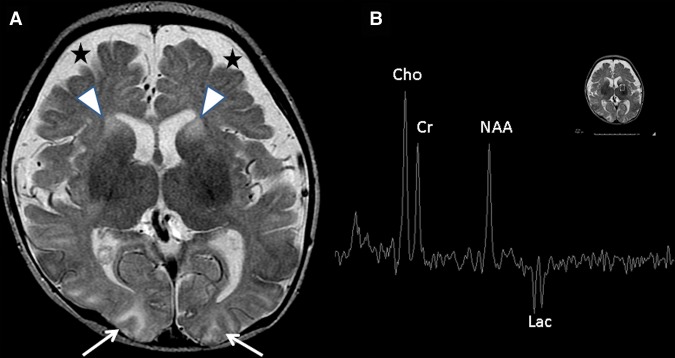
Figure 1.
Magnetic resonance imaging (MRI) study demonstrates progression of mitochondrial disease. (A) Restricted diffusion in the basal ganglia, brainstem, and occipital lobe (white arrows) were noted, as well as abnormal T2 signal intensity in the bilateral caudate heads and anterior putamina (arrowheads). Extra-axial spaces were pronounced anteriorly (stars). (B) Inverted lactate doublet is seen at 1.33 ppm on MRI spectroscopy from a voxel placed over the basal ganglia.

