
FIGURE 1.
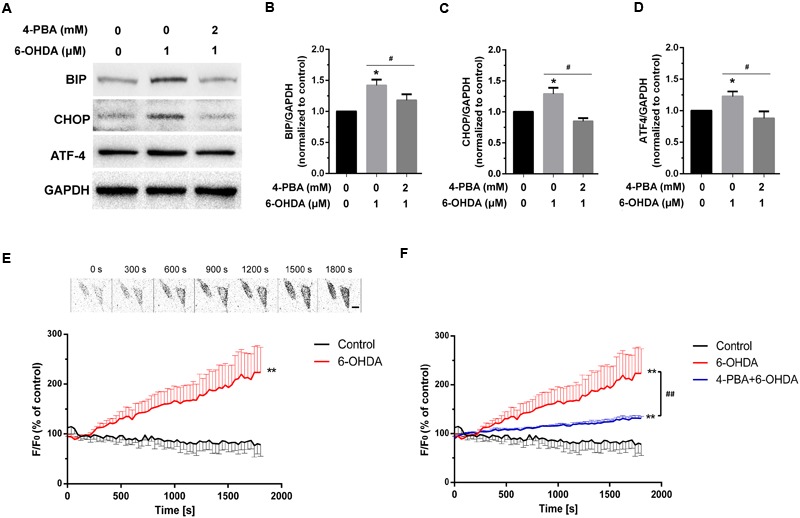
The effect of 4-PBA on 6-OHDA-induced Ca2+ dyshomeostasis in DA neurons. Western blot and analysis of SN4741 cells treated with 6-OHDA (1 μM) without or with 4-PBA (2 mM) pretreatment for 20 min (A–D). Plots of the fluorescence ratio in DA neurons treated with 6-OHDA (1 μM) without (E) or with (F) 4-PBA (2 mM) pretreatment for 20 min. The sketch map in (E) was just a series of screenshot of one cell in the group attempted to offer direct-viewing impression of our data. Data are shown as mean ± SEM (n = 10). The Plots of the fluorescence ratio was analyzed using two-way ANOVA and the row factor was time, while the Western blot was analyzed through gray-scale value. BIP: Control, 1(set as standard); 6-OHDA 1.42 ± 0.09; 4-PBA+6-OHDA, 1.18 ± 0.10. ATF4: Control, 1(set as standard); 6-OHDA 1.23 ± 0.08; 4-PBA+6-OHDA, 0.88 ± 0.11. CHOP: Control, 1(set as standard); 6-OHDA 1.28 ± 0.10; 4-PBA+6-OHDA, 0.85 ± 0.05. ∗P < 0.05 and ∗∗P < 0.01 vs. the control group; #P < 0.05 and ##P < 0.01 in the chosen groups. Scale bar = 25 μm.