
FIGURE 3.
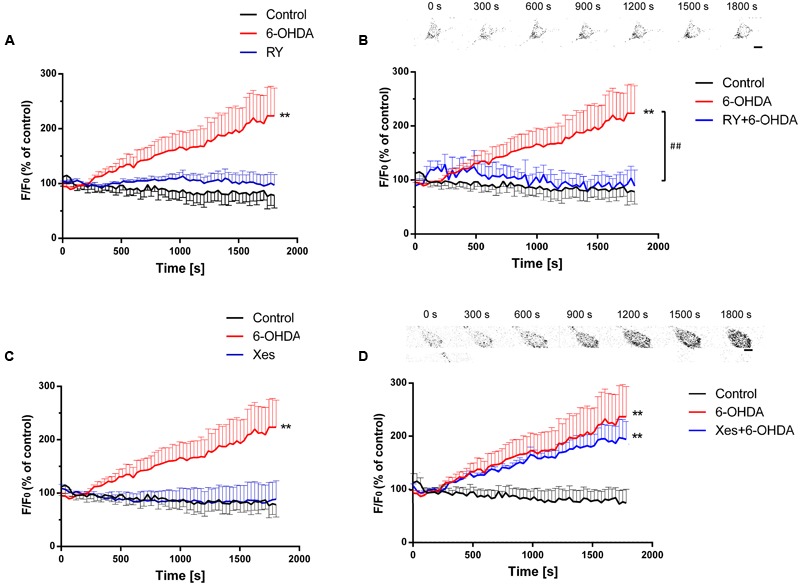
The different effects of IP3Rs and RyRs on 6-OHDA-induced Ca2+ overload in DA neurons. Plots of the fluorescence ratio in DA neurons treated with RY (100 μM) or 6-OHDA (1 μM) alone (A), pretreated with RY (100 μM) for 20 min and then with 6-OHDA (1 μM) (B), treated with Xes (800 nM) or 6-OHDA (1 μM) alone (C), or pretreated with Xes (800 nM) for 20 min and then with 6-OHDA (1 μM) (D). The sketch map in (B,D) was just a series of screenshot of one cell in the group attempted to offer direct-viewing impression of our data. Data are shown as mean ± SEM (n = 10). The Plots of the fluorescence ratio was analyzed via two-way ANOVA, the row factor was time ∗∗P < 0.01 vs. the control group and ##P < 0.01 in the chosen groups. Scale bar = 25 μm.