
FIGURE 6.
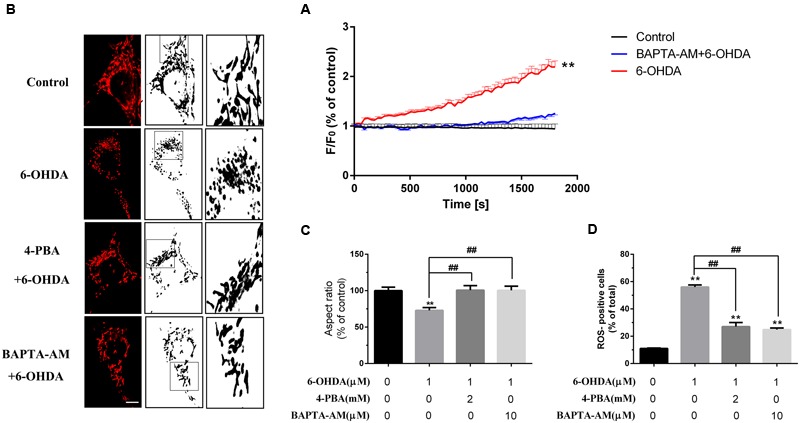
Blockade of ER stress and Ca2+ overload protected against mitochondrial dysfunction induced by 6-OHDA. Plots of the fluorescence ratio in DA neurons treated with 6-OHDA (1 μM) without or with pretreatment of BAPTA-AM (10 μM) for 20 min (A). Mitochondrial morphology and analysis of SN4741 cells treated with 6-0HDA (1 μm) without or with pretreatment of BAPTA-AM (10 μM) or 4-PBA (2 mM) for 20 min (B,C). ROS of SN4741 cells treated with 6-0HDA (1 μm) without or with pretreatment of BAPTA-AM (10 μM) or 4-PBA (2 mM) for 20 min (D). Data are shown as mean ± SEM (n = 7). The Plots of the fluorescence ratio was analyzed using two-way ANOVA and the row factor was time, while the mitochondrial morphology was analyzed through Aspect ratio and ROS through positive cells ratio via one-way ANOVA. Aspect ratio: Control, 100% (set as standard); 6-OHDA, 72.97 ± 3.83%; 4-PBA+6-OHDA, 100.17 ± 6.22%; BAPTA-AM+6-OHDA, 100.04 ± 5.73%. ROS: Control, 11.02 ± 0.30%; 6-OHDA, 56.04 ± 1.49%; 4-PBA+6-OHDA, 27.04 ± 2.98%; BAPTA-AM+6-OHDA, 28.70 ± 1.20%. ∗∗P < 0.01 vs. the control group and ##P < 0.01 in the chosen groups. Scale bar = 20 μm.