
Figure 1.
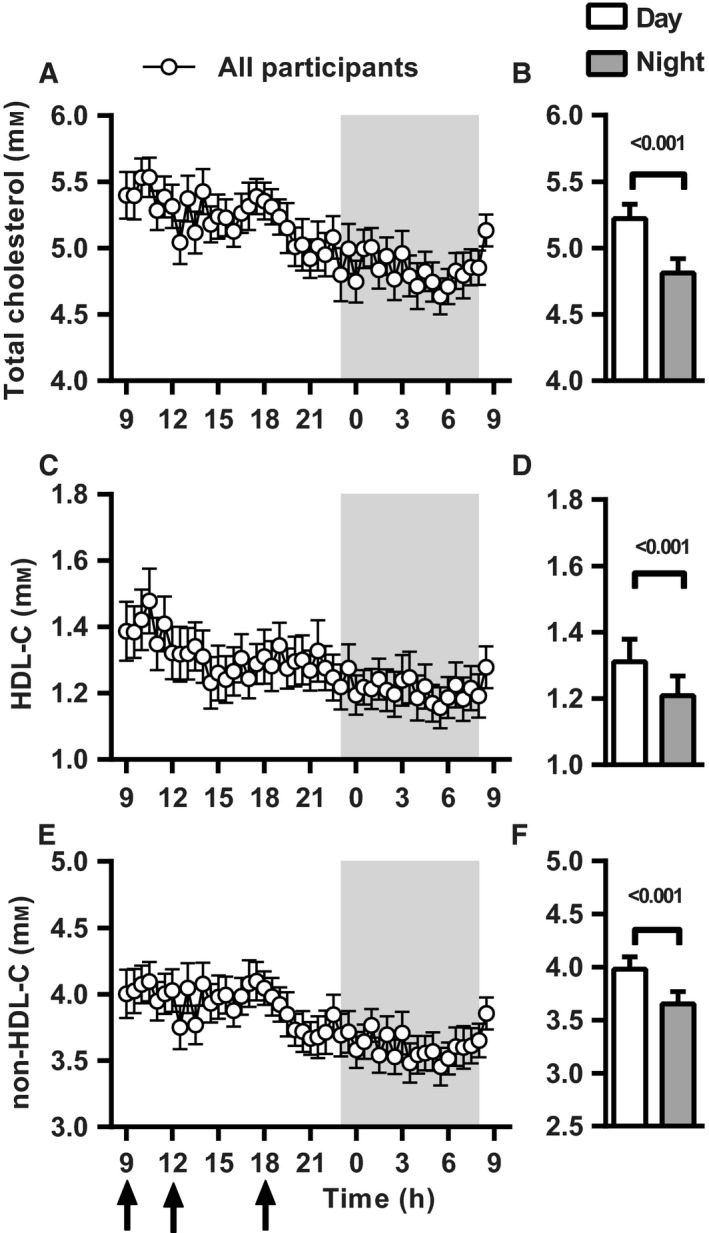
Circadian pattern of serum cholesterol concentrations in all participants combined. Mean serum cholesterol concentrations are displayed every 30 min over a 24‐h period for all participants combined (n = 37); total cholesterol (TC) (A), HDL cholesterol (HDL‐C) (C) and non‐HDL cholesterol (non‐HDL‐C) (E) Shaded area indicates dark/sleeping period. Black arrows indicate the time of three isocaloric meals (9:00 h, 12:00 h and 18:00 h). B, D and F present the mean ± SEM serum cholesterol concentrations during the day and night period for TC, HDL‐C and non‐HDL‐C, respectively.