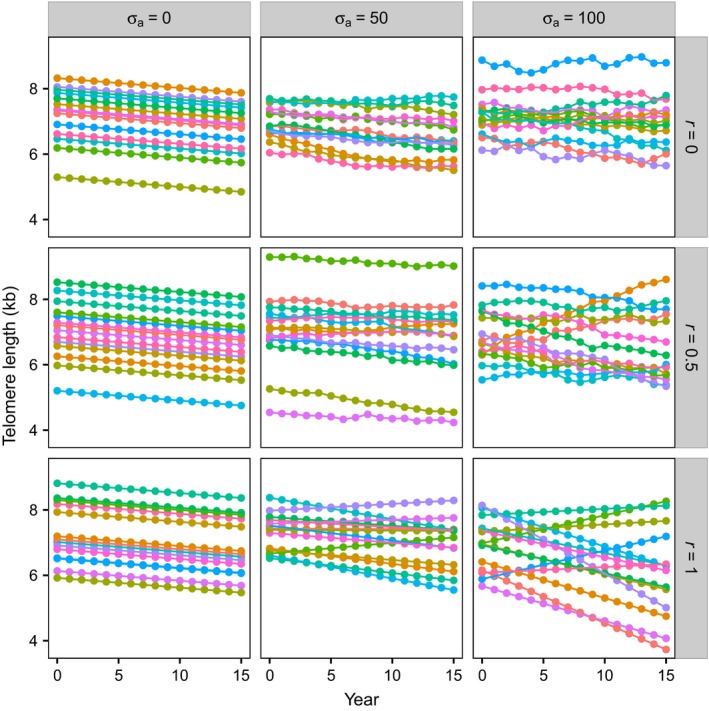
Figure 2.

Simulations produce scenarios with differing telomere dynamics. Panels show examples of the true TL data (i.e. without added measurement error) produced by the computational model using the default values given in Table 2. True TL is plotted as a function of year for the nine scenarios obtained by combining three values of the standard deviation of annual attrition, σa (columns), with three values of the autocorrelation of annual attrition, r (rows). For clarity, each panel shows TL data from only 15 randomly chosen individuals from the 10 000 in each simulation.
