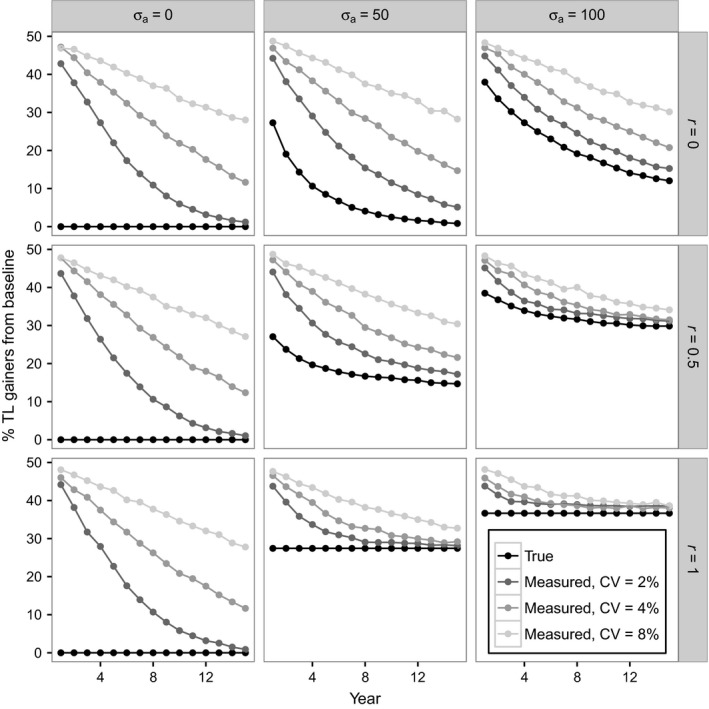
Figure 3.

Observed percentage of TL gainers always declines with follow‐up period independent of the telomere dynamics assumed. Panels show percentage of individuals showing a gain in TL from baseline in each follow‐up year for the same nine scenarios depicted in Fig. 2. The black lines show the percentage of true TL gainers from baseline. The grey lines show the percentage of observed TL gainers from baseline given different levels of measurement error at baseline and follow‐up (CVs of 2, 4 and 8%). Simulations assumed the default values in Table 2; TL was ‘measured’ only once at each time point.
